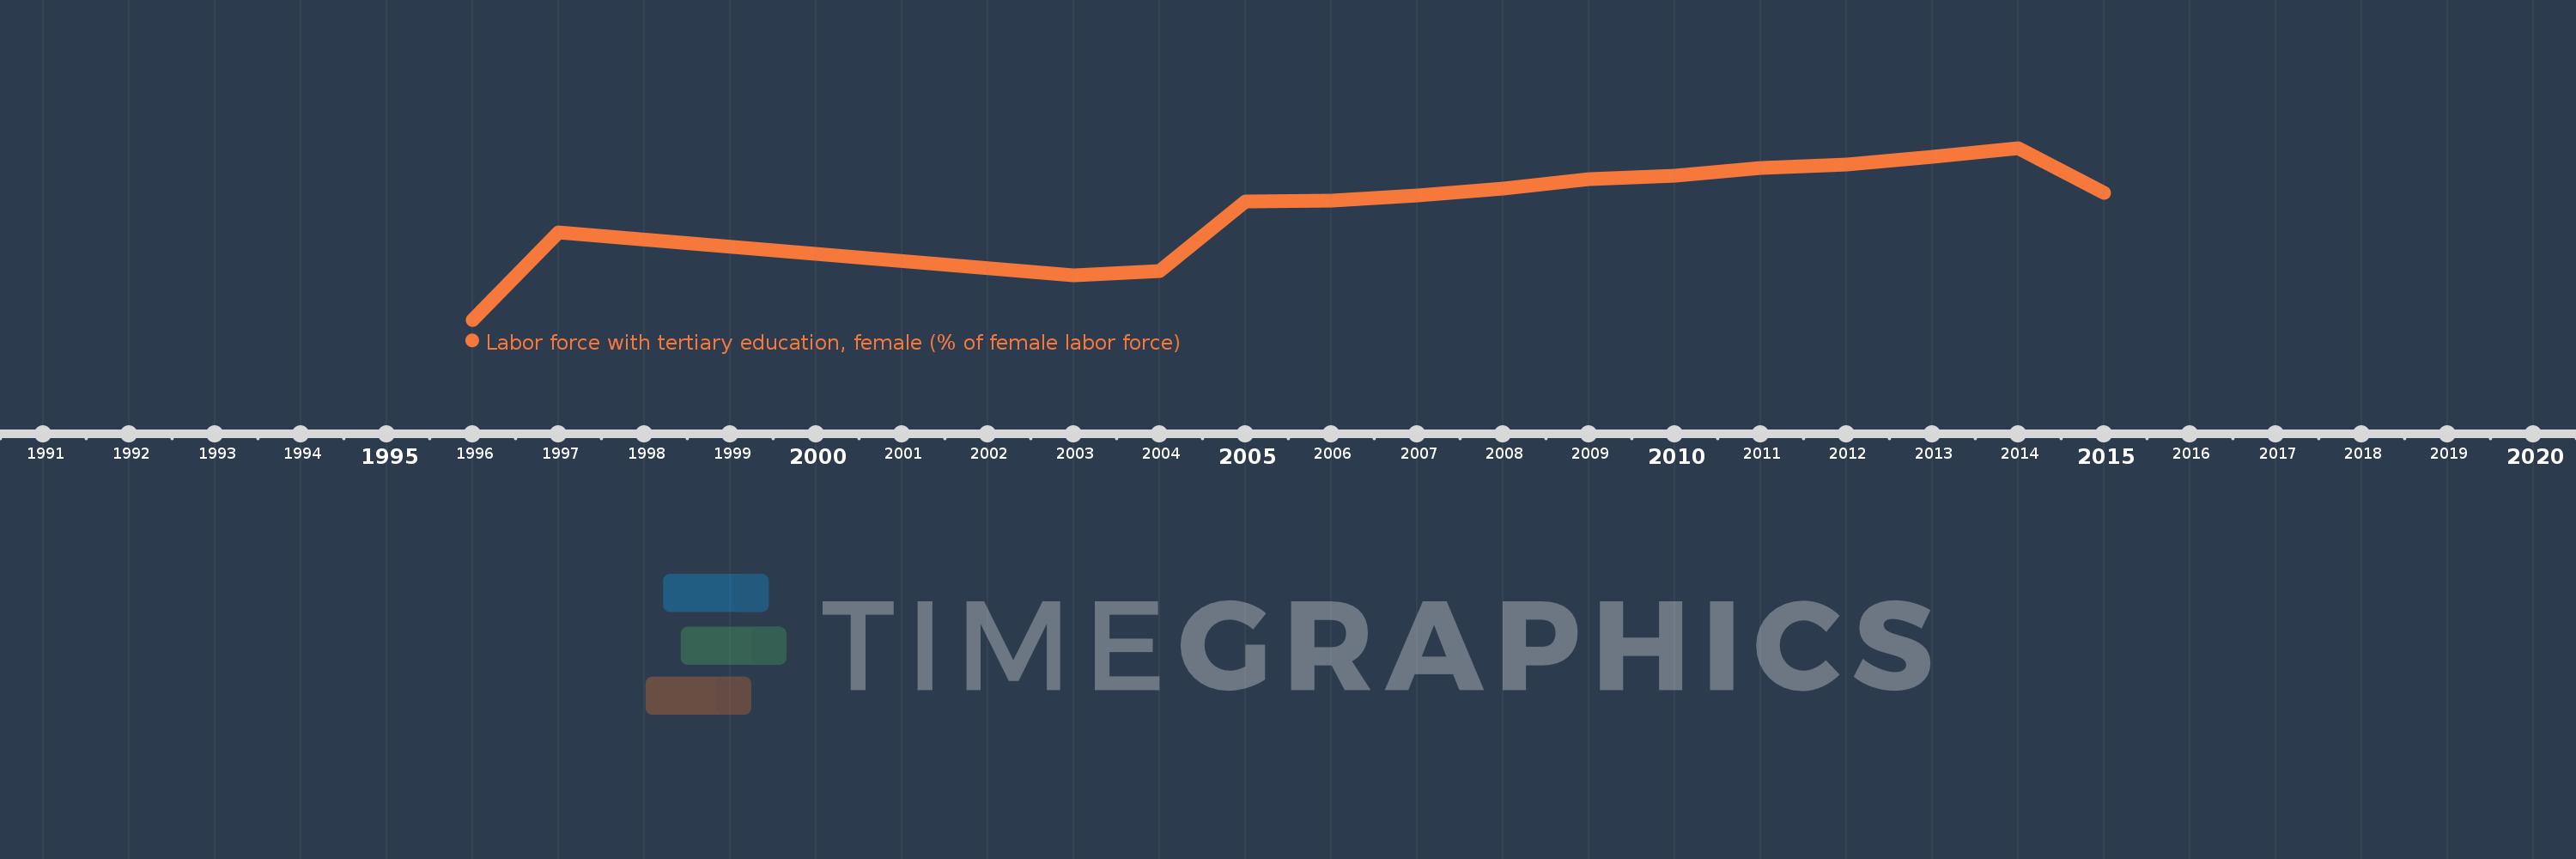
Questa scala temporale mostra un grafico dal 1996 anno al 2015 anno. Europe & Central Asia. I dati fino ad 1995 anno non disponibili. Il numero di osservazioni attuali secondo i date: 15.
La fonte (nome):
Indicatori dello sviluppo mondiale
La fonte (organizzazione):
International Labour Organization, Key Indicators of the Labour Market database.
Categorie:
Education, Social Protection & Labor, Gender
sono stati aggiornati
23 apr 2017 anni
Indicatori delle variazioni dei valori per anni
In media:
32.854
Minima:
18.726
1 gen 1996 anni
Massimo:
39.813
1 gen 2014 anni
Alla data di osservazione
Valore
Variazione assoluta
La variazione rispetto al valore precedente
1 gen 1996 anni
18.726
+18.726
0.0%
1 gen 1997 anni
29.497
+10.771
57.52%
1 gen 2003 anni
24.229
-5.268
-17.86%
1 gen 2004 anni
24.682
+0.453
1.87%
1 gen 2005 anni
33.247
+8.565
34.7%
1 gen 2006 anni
33.348
+0.101
0.3%
1 gen 2007 anni
33.998
+0.65
1.95%
1 gen 2008 anni
34.82
+0.822
2.42%
1 gen 2009 anni
35.937
+1.117
3.21%
1 gen 2010 anni
36.365
+0.429
1.19%
1 gen 2011 anni
37.349
+0.984
2.71%
1 gen 2012 anni
37.79
+0.441
1.18%
1 gen 2013 anni
38.751
+0.961
2.54%
1 gen 2014 anni
39.813
+1.062
2.74%
1 gen 2015 anni
34.252
-5.561
-13.97%
Classificazione dei paesi secondo i statistiche attuali per anni