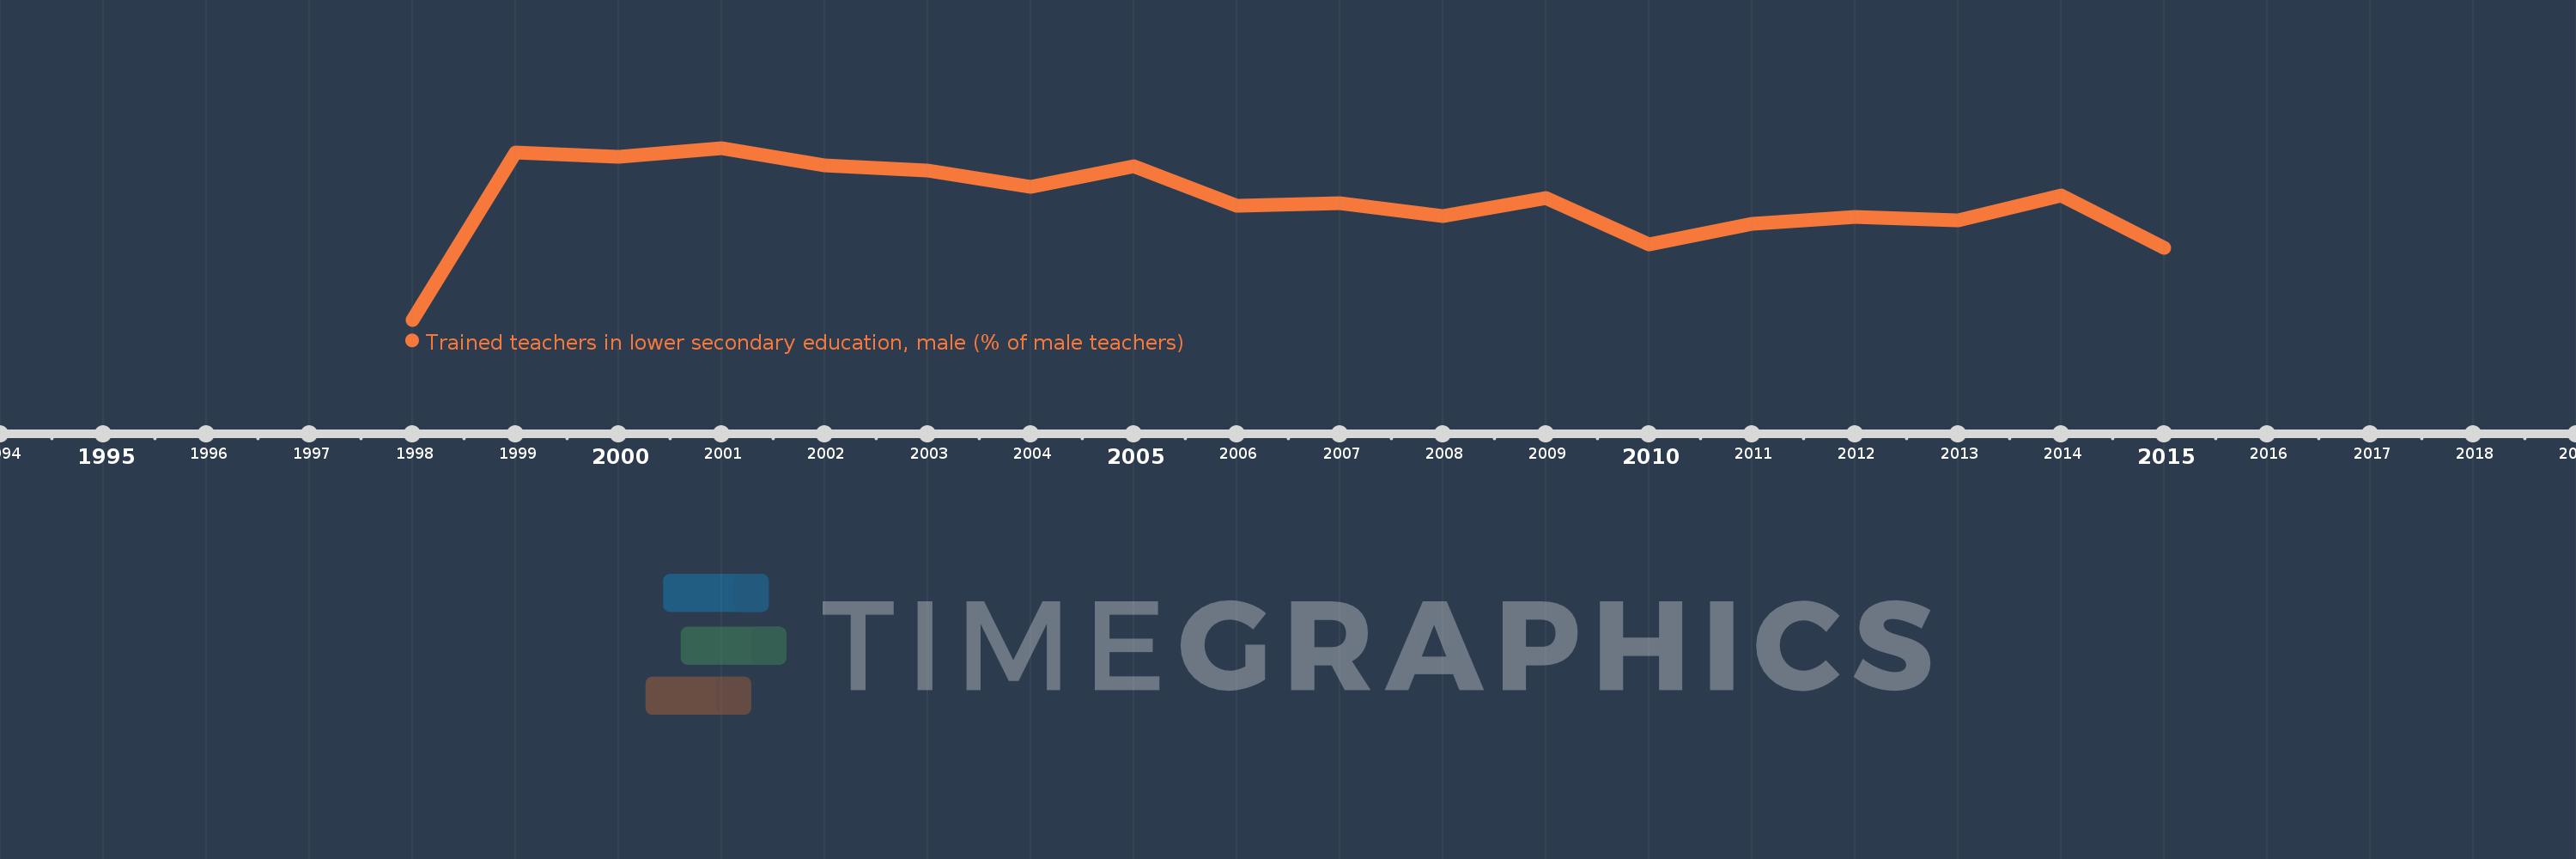
Questa scala temporale mostra un grafico dal 1998 anno al 2015 anno. IDA only. I dati fino ad 1997 anno non disponibili. Il numero di osservazioni attuali secondo i date: 18.
La fonte (nome):
Indicatori dello sviluppo mondiale
La fonte (organizzazione):
United Nations Educational, Scientific, and Cultural Organization (UNESCO) Institute for Statistics.
Categorie:
Education
sono stati aggiornati
23 apr 2017 anni
Indicatori delle variazioni dei valori per anni
In media:
63.852
Minima:
52.326
1 gen 1998 anni
Massimo:
69.142
1 gen 2001 anni
Alla data di osservazione
Valore
Variazione assoluta
La variazione rispetto al valore precedente
1 gen 1998 anni
52.326
+52.326
0.0%
1 gen 1999 anni
68.714
+16.389
31.32%
1 gen 2000 anni
68.245
-0.469
-0.68%
1 gen 2001 anni
69.142
+0.897
1.31%
1 gen 2002 anni
67.47
-1.671
-2.42%
1 gen 2003 anni
66.927
-0.543
-0.81%
1 gen 2004 anni
65.354
-1.573
-2.35%
1 gen 2005 anni
67.339
+1.985
3.04%
1 gen 2006 anni
63.506
-3.833
-5.69%
1 gen 2007 anni
63.772
+0.265
0.42%
1 gen 2008 anni
62.452
-1.32
-2.07%
1 gen 2009 anni
64.25
+1.798
2.88%
1 gen 2010 anni
59.69
-4.559
-7.1%
1 gen 2011 anni
61.753
+2.063
3.46%
1 gen 2012 anni
62.424
+0.671
1.09%
1 gen 2013 anni
62.073
-0.351
-0.56%
1 gen 2014 anni
64.508
+2.435
3.92%
1 gen 2015 anni
59.4
-5.108
-7.92%
Classificazione dei paesi secondo i statistiche attuali per anni