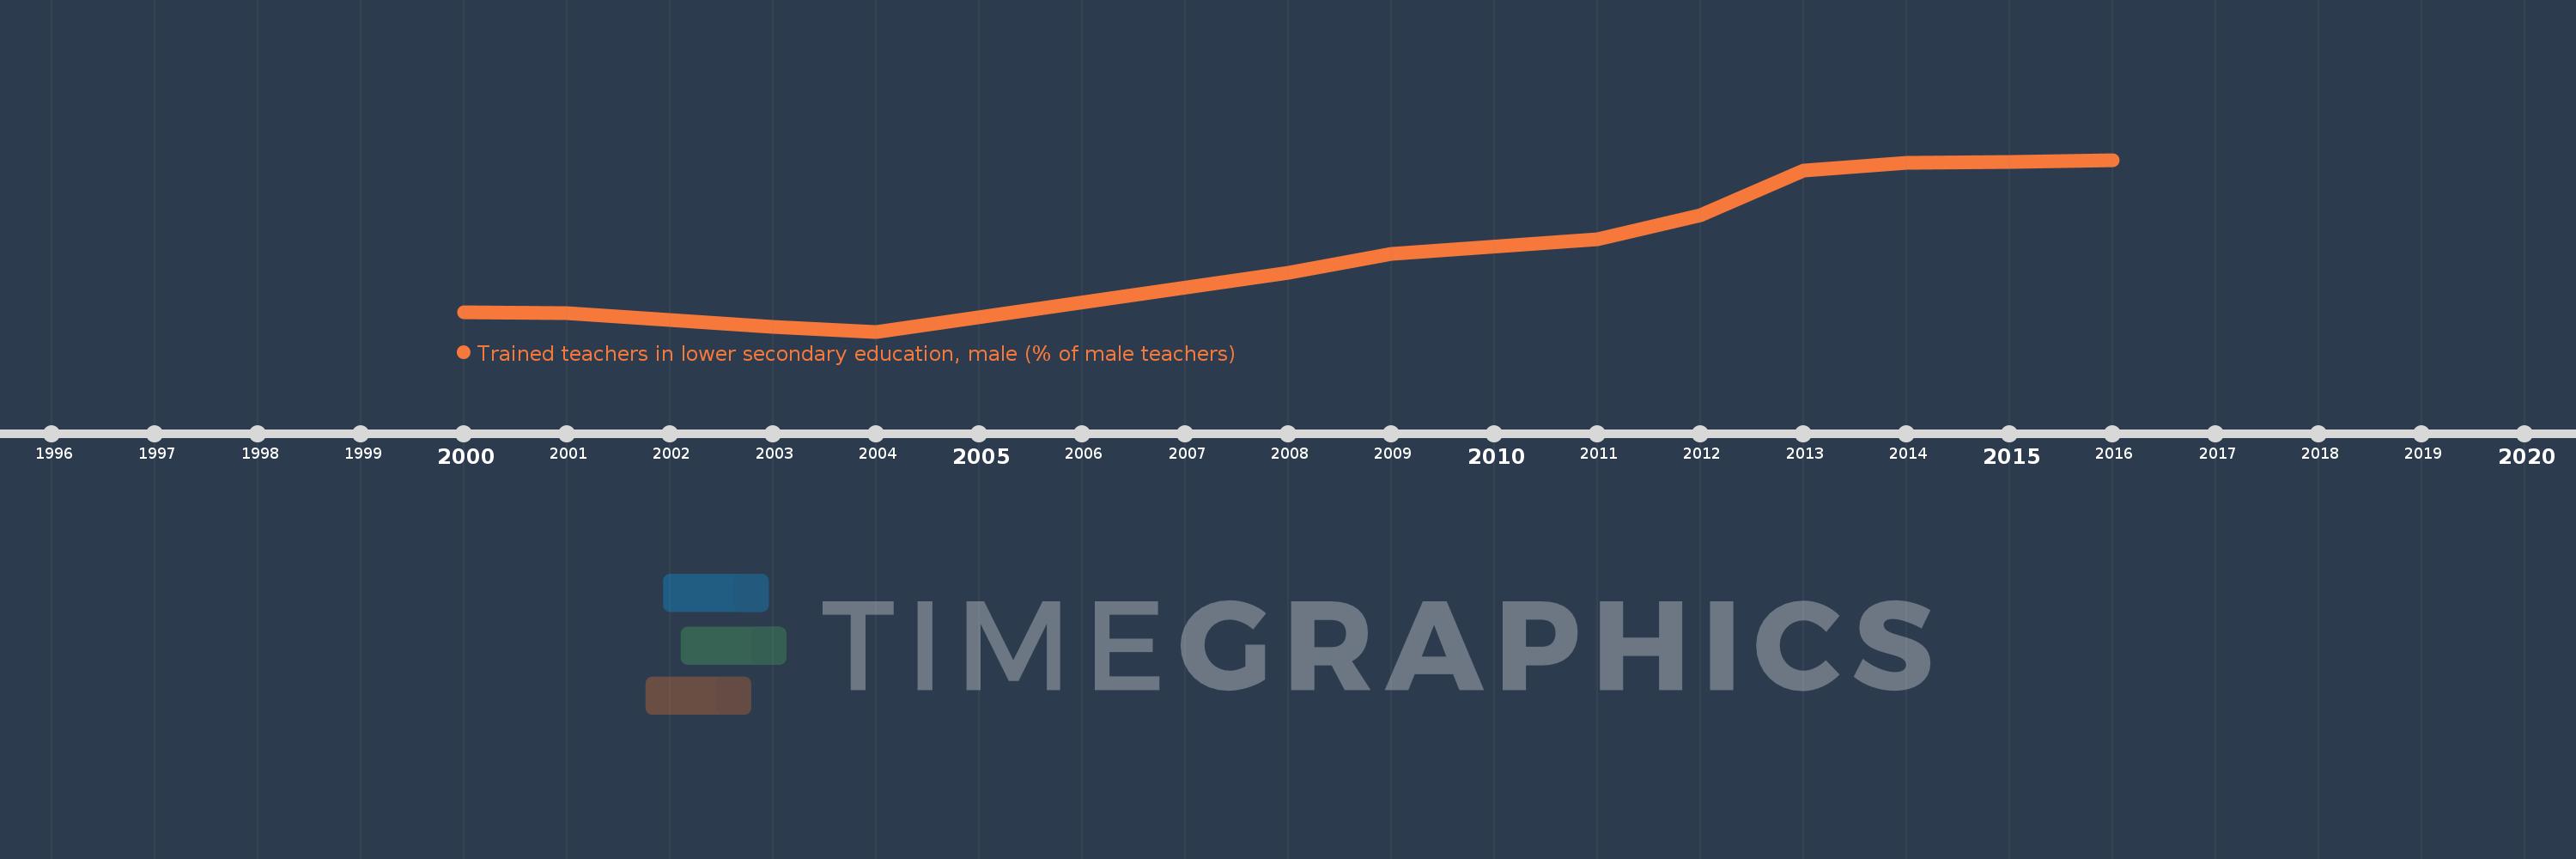
Questa scala temporale mostra un grafico dal 2000 anno al 2016 anno. Nepal. I dati fino ad 1999 anno non disponibili. Il numero di osservazioni attuali secondo i date: 12.
La fonte (nome):
Indicatori dello sviluppo mondiale
La fonte (organizzazione):
United Nations Educational, Scientific, and Cultural Organization (UNESCO) Institute for Statistics.
Categorie:
Education
sono stati aggiornati
23 apr 2017 anni
Indicatori delle variazioni dei valori per anni
In media:
54.525
Minima:
26.547
1 gen 2004 anni
Massimo:
80.96
1 gen 2016 anni
Alla data di osservazione
Valore
Variazione assoluta
La variazione rispetto al valore precedente
1 gen 2000 anni
32.661
+32.661
0.0%
1 gen 2001 anni
32.527
-0.133
-0.41%
1 gen 2003 anni
28.154
-4.373
-13.45%
1 gen 2004 anni
26.547
-1.607
-5.71%
1 gen 2008 anni
45.136
+18.589
70.02%
1 gen 2009 anni
51.27
+6.134
13.59%
1 gen 2011 anni
55.664
+4.395
8.57%
1 gen 2012 anni
63.477
+7.813
14.04%
1 gen 2013 anni
77.67
+14.193
22.36%
1 gen 2014 anni
79.882
+2.212
2.85%
1 gen 2015 anni
80.349
+0.467
0.58%
1 gen 2016 anni
80.96
+0.61
0.76%
Classificazione dei paesi secondo i statistiche attuali per anni