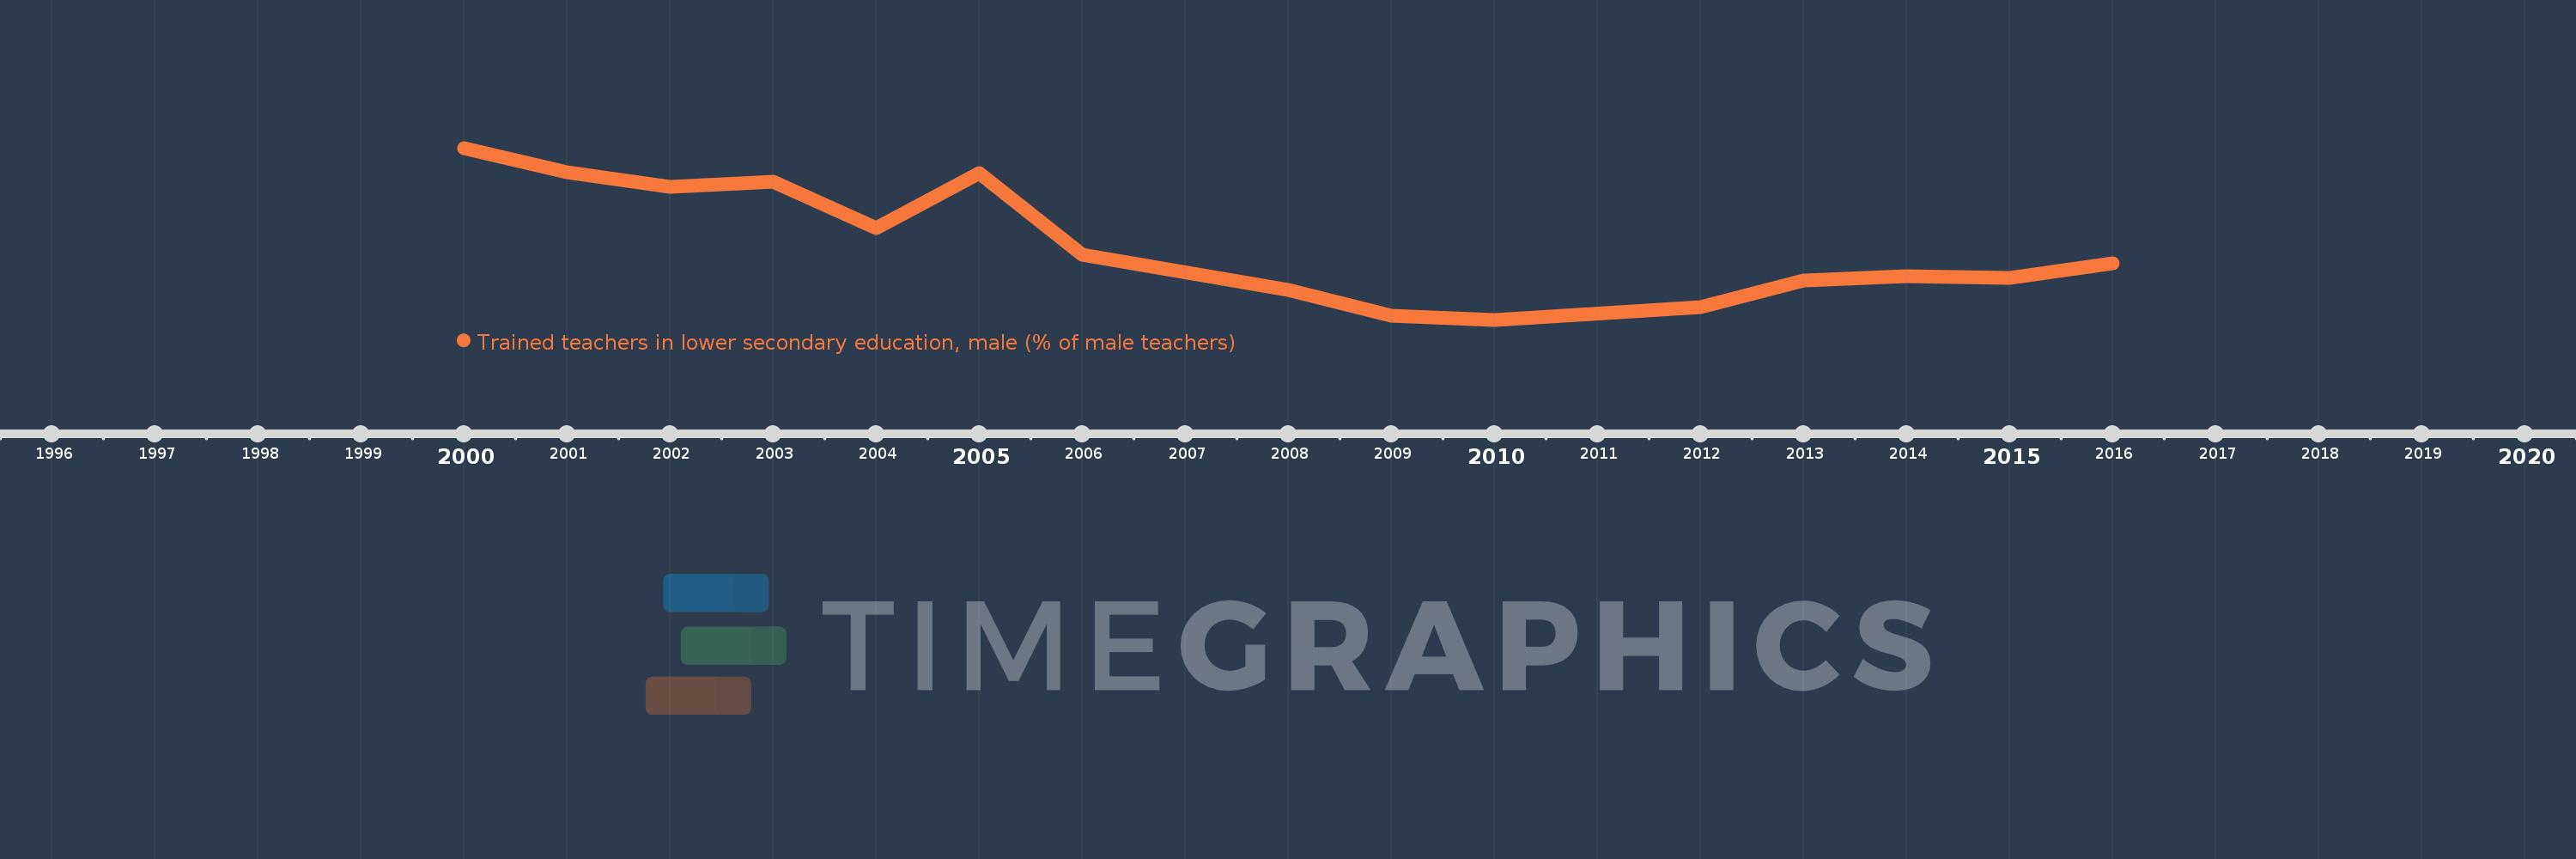
Questa scala temporale mostra un grafico dal 2000 anno al 2016 anno. Ghana. I dati fino ad 1999 anno non disponibili. Il numero di osservazioni attuali secondo i date: 15.
La fonte (nome):
Indicatori dello sviluppo mondiale
La fonte (organizzazione):
United Nations Educational, Scientific, and Cultural Organization (UNESCO) Institute for Statistics.
Categorie:
Education
sono stati aggiornati
23 apr 2017 anni
Indicatori delle variazioni dei valori per anni
In media:
68.042
Minima:
59.399
1 gen 2010 anni
Massimo:
79.269
1 gen 2000 anni
Alla data di osservazione
Valore
Variazione assoluta
La variazione rispetto al valore precedente
1 gen 2000 anni
79.269
+79.269
0.0%
1 gen 2001 anni
76.492
-2.776
-3.5%
1 gen 2002 anni
74.742
-1.751
-2.29%
1 gen 2003 anni
75.402
+0.66
0.88%
1 gen 2004 anni
70.035
-5.366
-7.12%
1 gen 2005 anni
76.351
+6.315
9.02%
1 gen 2006 anni
66.887
-9.464
-12.4%
1 gen 2008 anni
62.871
-4.016
-6.0%
1 gen 2009 anni
59.894
-2.977
-4.73%
1 gen 2010 anni
59.399
-0.495
-0.83%
1 gen 2012 anni
60.836
+1.437
2.42%
1 gen 2013 anni
63.915
+3.079
5.06%
1 gen 2014 anni
64.403
+0.488
0.76%
1 gen 2015 anni
64.211
-0.192
-0.3%
1 gen 2016 anni
65.93
+1.719
2.68%
Classificazione dei paesi secondo i statistiche attuali per anni