33
/it/
AIzaSyAYiBZKx7MnpbEhh9jyipgxe19OcubqV5w
August 1, 2025
37809
IDA & IBRD total
IBT
false
2
1
Stocks traded, total value (current US$)
2016,2015,2014,2013,2012,2011,2010,2009,2008,2007,2006,2005,2004,2003,2002,2001,2000,1999,1998,1997,1996,1995,1994
Download
Biblioteca di statistiche globali →IDA & IBRD total →

Stocks traded, total value (current US$)

Queste statistiche in altri paesi:

Arab WorldArgentinaArmeniaAustraliaAustriaBahrainBangladeshBarbadosBelgiumBermudaBoliviaBotswanaBrazilBulgariaCanadaCayman IslandsCentral Europe and the BalticsChannel IslandsChileChinaColombiaCosta RicaCote d'IvoireCroatiaCyprusCzech RepublicDenmarkEarly-demographic dividendEast Asia & PacificEast Asia & Pacific (excluding high income)East Asia & Pacific (IDA & IBRD countries)EcuadorEgypt, Arab Rep.El SalvadorEstoniaEuro areaEurope & Central AsiaEurope & Central Asia (excluding high income)Europe & Central Asia (IDA & IBRD countries)European UnionFijiFinlandFranceGeorgiaGermanyGhanaGreeceGuyanaHigh incomeHong Kong SAR, ChinaHungaryIBRD onlyIcelandIDA & IBRD totalIDA blendIDA totalIndiaIndonesiaIran, Islamic Rep.IrelandIsraelItalyJamaicaJapanJordanKazakhstanKenyaKorea, Rep.KuwaitKyrgyz RepublicLate-demographic dividendLatin America & Caribbean Latin America & Caribbean (excluding high income)Latin America & the Caribbean (IDA & IBRD countries)LatviaLebanonLithuaniaLow & middle incomeLower middle incomeLuxembourgMacedonia, FYRMalawiMalaysiaMaltaMauritiusMexicoMiddle East & North AfricaMiddle East & North Africa (excluding high income)Middle East & North Africa (IDA & IBRD countries)Middle incomeMoldovaMongoliaMontenegroMoroccoNamibiaNetherlandsNew ZealandNigeriaNorth AmericaNorwayOECD membersOmanOther small statesPakistanPanamaPapua New GuineaParaguayPeruPhilippinesPolandPortugalPost-demographic dividendQatarRomaniaRussian FederationSaudi ArabiaSerbiaSeychellesSingaporeSlovak RepublicSloveniaSouth AfricaSouth AsiaSouth Asia (IDA & IBRD)SpainSri LankaSt. Kitts and NevisSub-Saharan Africa Sub-Saharan Africa (excluding high income)Sub-Saharan Africa (IDA & IBRD countries)SwazilandSwedenSwitzerlandTanzaniaThailandTrinidad and TobagoTunisiaTurkeyUgandaUkraineUnited Arab EmiratesUnited KingdomUnited StatesUpper middle incomeUruguayUzbekistanVenezuela, RBVietnamWest Bank and GazaWorldZambiaZimbabwe

Linea del tempo:

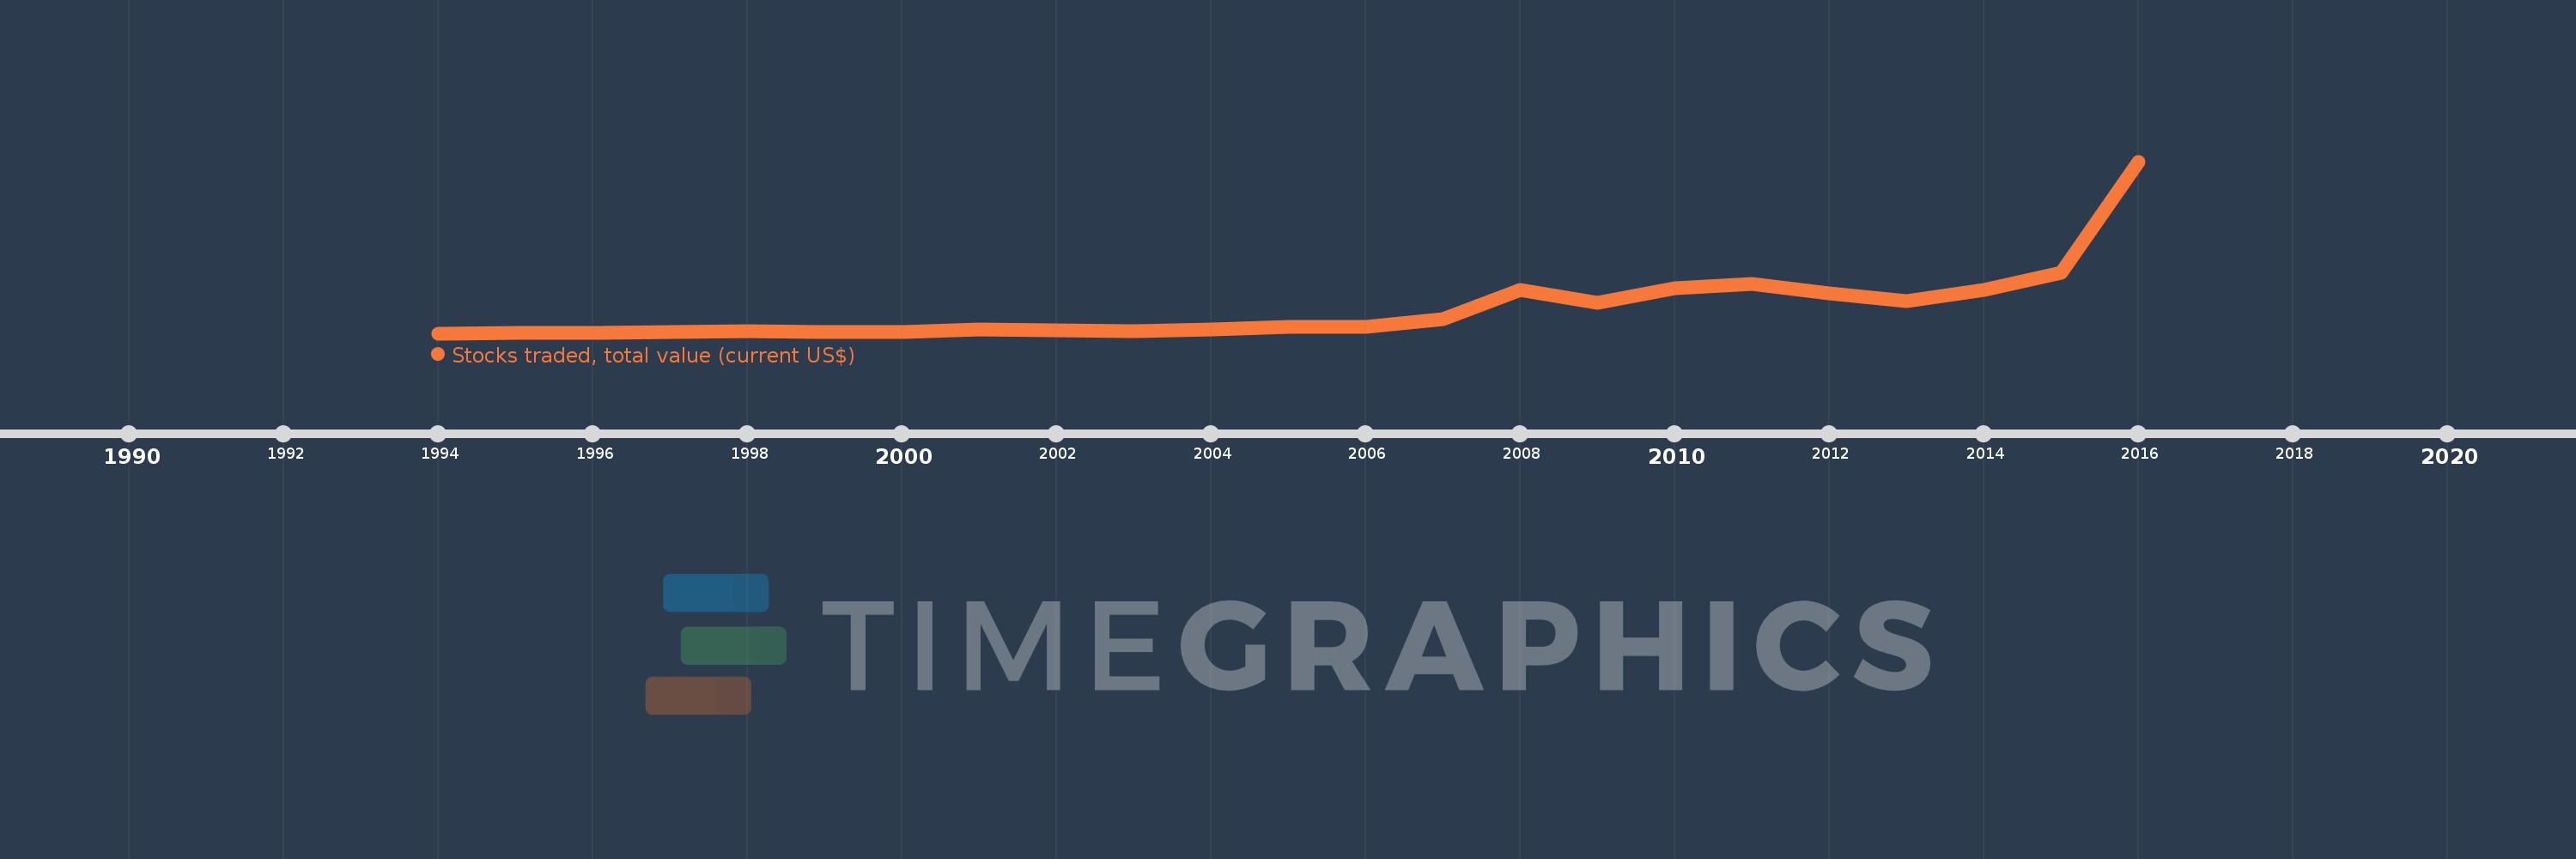
Questa scala temporale mostra un grafico dal 1994 anno al 2016 anno. IDA & IBRD total. I dati fino ad 1993 anno non disponibili. Il numero di osservazioni attuali secondo i date: 23.

La fonte (nome):

Indicatori dello sviluppo mondiale

La fonte (organizzazione):

World Federation of Exchanges database.

Categorie:

Financial Sector

sono stati aggiornati

23 apr 2017 anni

Indicatori delle variazioni dei valori per anni

In media:
6.281 Trln
Minima:
339.96 Mlrd
1 gen 1994 anni
Massimo:
41.965 Trln
1 gen 2016 anni
Alla data di osservazione
Valore
Variazione assoluta
La variazione rispetto al valore precedente
1 gen 1994 anni
339.96 Mlrd
+339.96 Mlrd
0.0%
1 gen 1995 anni
494.689 Mlrd
+154.729 Mlrd
45.51%
1 gen 1996 anni
462.355 Mlrd
-32.334 Mlrd
-6.54%
1 gen 1997 anni
678.218 Mlrd
+215.863 Mlrd
46.69%
1 gen 1998 anni
918.099 Mlrd
+239.881 Mlrd
35.37%
1 gen 1999 anni
742.281 Mlrd
-175.818 Mlrd
-19.15%
1 gen 2000 anni
727.4 Mlrd
-14.882 Mlrd
-2.0%
1 gen 2001 anni
1.324 Trln
+596.793 Mlrd
82.04%
1 gen 2002 anni
968.143 Mlrd
-356.049 Mlrd
-26.89%
1 gen 2003 anni
791.152 Mlrd
-176.991 Mlrd
-18.28%
1 gen 2004 anni
1.178 Trln
+387.048 Mlrd
48.92%
1 gen 2005 anni
1.814 Trln
+635.999 Mlrd
53.98%
1 gen 2006 anni
1.96 Trln
+145.655 Mlrd
8.03%
1 gen 2007 anni
3.701 Trln
+1.741 Trln
88.84%
1 gen 2008 anni
10.884 Trln
+7.183 Trln
194.07%
1 gen 2009 anni
7.682 Trln
-3.202 Trln
-29.42%
1 gen 2010 anni
11.345 Trln
+3.663 Trln
47.68%
1 gen 2011 anni
12.293 Trln
+948.416 Mlrd
8.36%
1 gen 2012 anni
10.099 Trln
-2.194 Trln
-17.85%
1 gen 2013 anni
8.224 Trln
-1.875 Trln
-18.56%
1 gen 2014 anni
10.845 Trln
+2.621 Trln
31.87%
1 gen 2015 anni
15.024 Trln
+4.179 Trln
38.53%
1 gen 2016 anni
41.965 Trln
+26.94 Trln
179.31%

Classificazione dei paesi secondo i statistiche attuali per anni