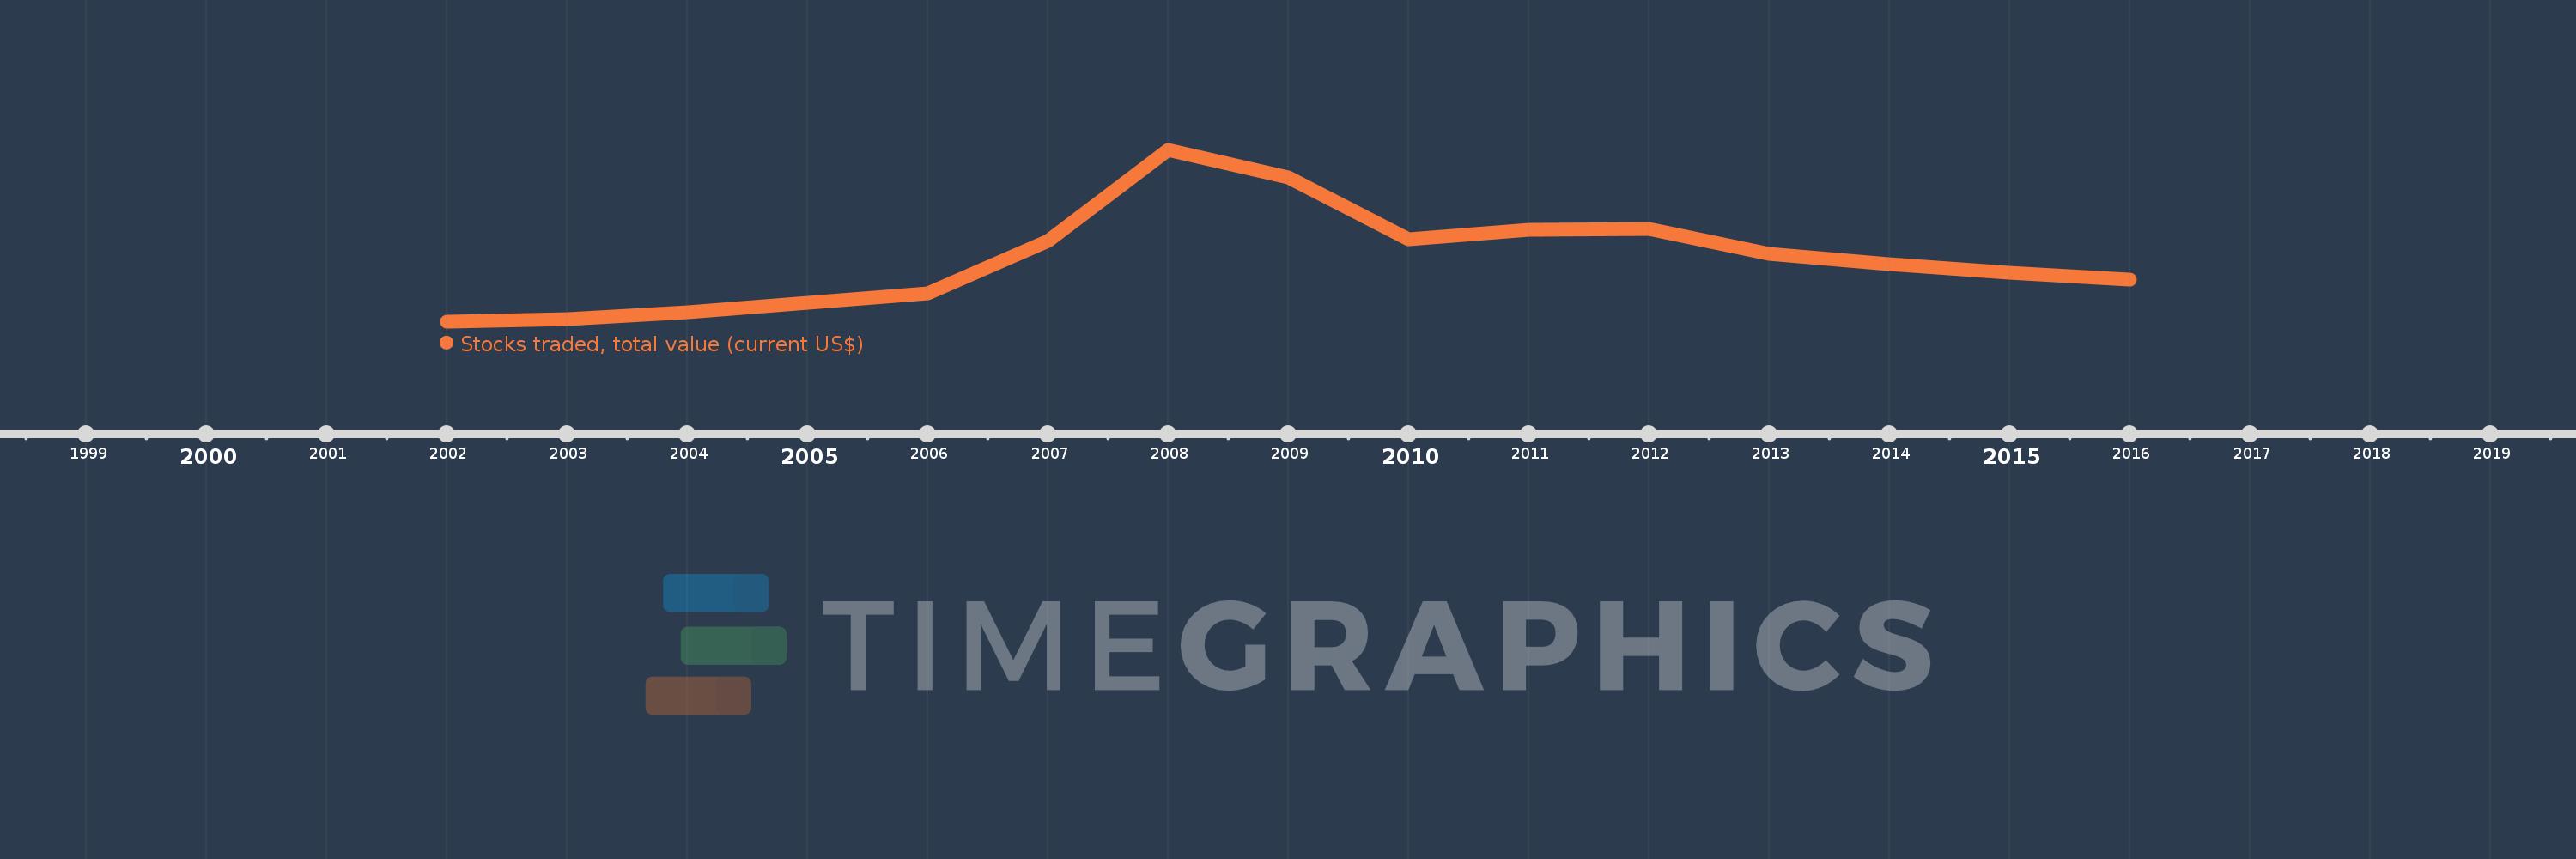
Questa scala temporale mostra un grafico dal 2002 anno al 2016 anno. Europe & Central Asia (excluding high income). I dati fino ad 2001 anno non disponibili. Il numero di osservazioni attuali secondo i date: 15.
La fonte (nome):
Indicatori dello sviluppo mondiale
La fonte (organizzazione):
World Federation of Exchanges database.
Categorie:
Financial Sector
sono stati aggiornati
23 apr 2017 anni
Indicatori delle variazioni dei valori per anni
In media:
654.757 Mlrd
Minima:
94.253 Mlrd
1 gen 2002 anni
Massimo:
1.625 Trln
1 gen 2008 anni
Alla data di osservazione
Valore
Variazione assoluta
La variazione rispetto al valore precedente
1 gen 2002 anni
94.253 Mlrd
+94.253 Mlrd
0.0%
1 gen 2003 anni
116.186 Mlrd
+21.934 Mlrd
23.27%
1 gen 2004 anni
179.27 Mlrd
+63.084 Mlrd
54.3%
1 gen 2005 anni
268.181 Mlrd
+88.911 Mlrd
49.6%
1 gen 2006 anni
351.739 Mlrd
+83.558 Mlrd
31.16%
1 gen 2007 anni
817.107 Mlrd
+465.368 Mlrd
132.3%
1 gen 2008 anni
1.625 Trln
+807.629 Mlrd
98.84%
1 gen 2009 anni
1.384 Trln
-240.417 Mlrd
-14.8%
1 gen 2010 anni
830.345 Mlrd
-553.974 Mlrd
-40.02%
1 gen 2011 anni
915.965 Mlrd
+85.62 Mlrd
10.31%
1 gen 2012 anni
920.881 Mlrd
+4.916 Mlrd
0.54%
1 gen 2013 anni
703.682 Mlrd
-217.2 Mlrd
-23.59%
1 gen 2014 anni
612.752 Mlrd
-90.93 Mlrd
-12.92%
1 gen 2015 anni
532.287 Mlrd
-80.465 Mlrd
-13.13%
1 gen 2016 anni
469.658 Mlrd
-62.629 Mlrd
-11.77%
Classificazione dei paesi secondo i statistiche attuali per anni