33
/it/
AIzaSyAYiBZKx7MnpbEhh9jyipgxe19OcubqV5w
August 1, 2025
37020
IBRD only
IBD
false
2
1
Stocks traded, total value (current US$)
2016,2015,2014,2013,2012,2011,2010,2009,2008,2007,2006,2005,2004,2003,2002,2001,2000,1999,1998,1997,1996,1995,1994
Download
Biblioteca di statistiche globali →IBRD only →

Stocks traded, total value (current US$)

Queste statistiche in altri paesi:

Arab WorldArgentinaArmeniaAustraliaAustriaBahrainBangladeshBarbadosBelgiumBermudaBoliviaBotswanaBrazilBulgariaCanadaCayman IslandsCentral Europe and the BalticsChannel IslandsChileChinaColombiaCosta RicaCote d'IvoireCroatiaCyprusCzech RepublicDenmarkEarly-demographic dividendEast Asia & PacificEast Asia & Pacific (excluding high income)East Asia & Pacific (IDA & IBRD countries)EcuadorEgypt, Arab Rep.El SalvadorEstoniaEuro areaEurope & Central AsiaEurope & Central Asia (excluding high income)Europe & Central Asia (IDA & IBRD countries)European UnionFijiFinlandFranceGeorgiaGermanyGhanaGreeceGuyanaHigh incomeHong Kong SAR, ChinaHungaryIBRD onlyIcelandIDA & IBRD totalIDA blendIDA totalIndiaIndonesiaIran, Islamic Rep.IrelandIsraelItalyJamaicaJapanJordanKazakhstanKenyaKorea, Rep.KuwaitKyrgyz RepublicLate-demographic dividendLatin America & Caribbean Latin America & Caribbean (excluding high income)Latin America & the Caribbean (IDA & IBRD countries)LatviaLebanonLithuaniaLow & middle incomeLower middle incomeLuxembourgMacedonia, FYRMalawiMalaysiaMaltaMauritiusMexicoMiddle East & North AfricaMiddle East & North Africa (excluding high income)Middle East & North Africa (IDA & IBRD countries)Middle incomeMoldovaMongoliaMontenegroMoroccoNamibiaNetherlandsNew ZealandNigeriaNorth AmericaNorwayOECD membersOmanOther small statesPakistanPanamaPapua New GuineaParaguayPeruPhilippinesPolandPortugalPost-demographic dividendQatarRomaniaRussian FederationSaudi ArabiaSerbiaSeychellesSingaporeSlovak RepublicSloveniaSouth AfricaSouth AsiaSouth Asia (IDA & IBRD)SpainSri LankaSt. Kitts and NevisSub-Saharan Africa Sub-Saharan Africa (excluding high income)Sub-Saharan Africa (IDA & IBRD countries)SwazilandSwedenSwitzerlandTanzaniaThailandTrinidad and TobagoTunisiaTurkeyUgandaUkraineUnited Arab EmiratesUnited KingdomUnited StatesUpper middle incomeUruguayUzbekistanVenezuela, RBVietnamWest Bank and GazaWorldZambiaZimbabwe

Linea del tempo:

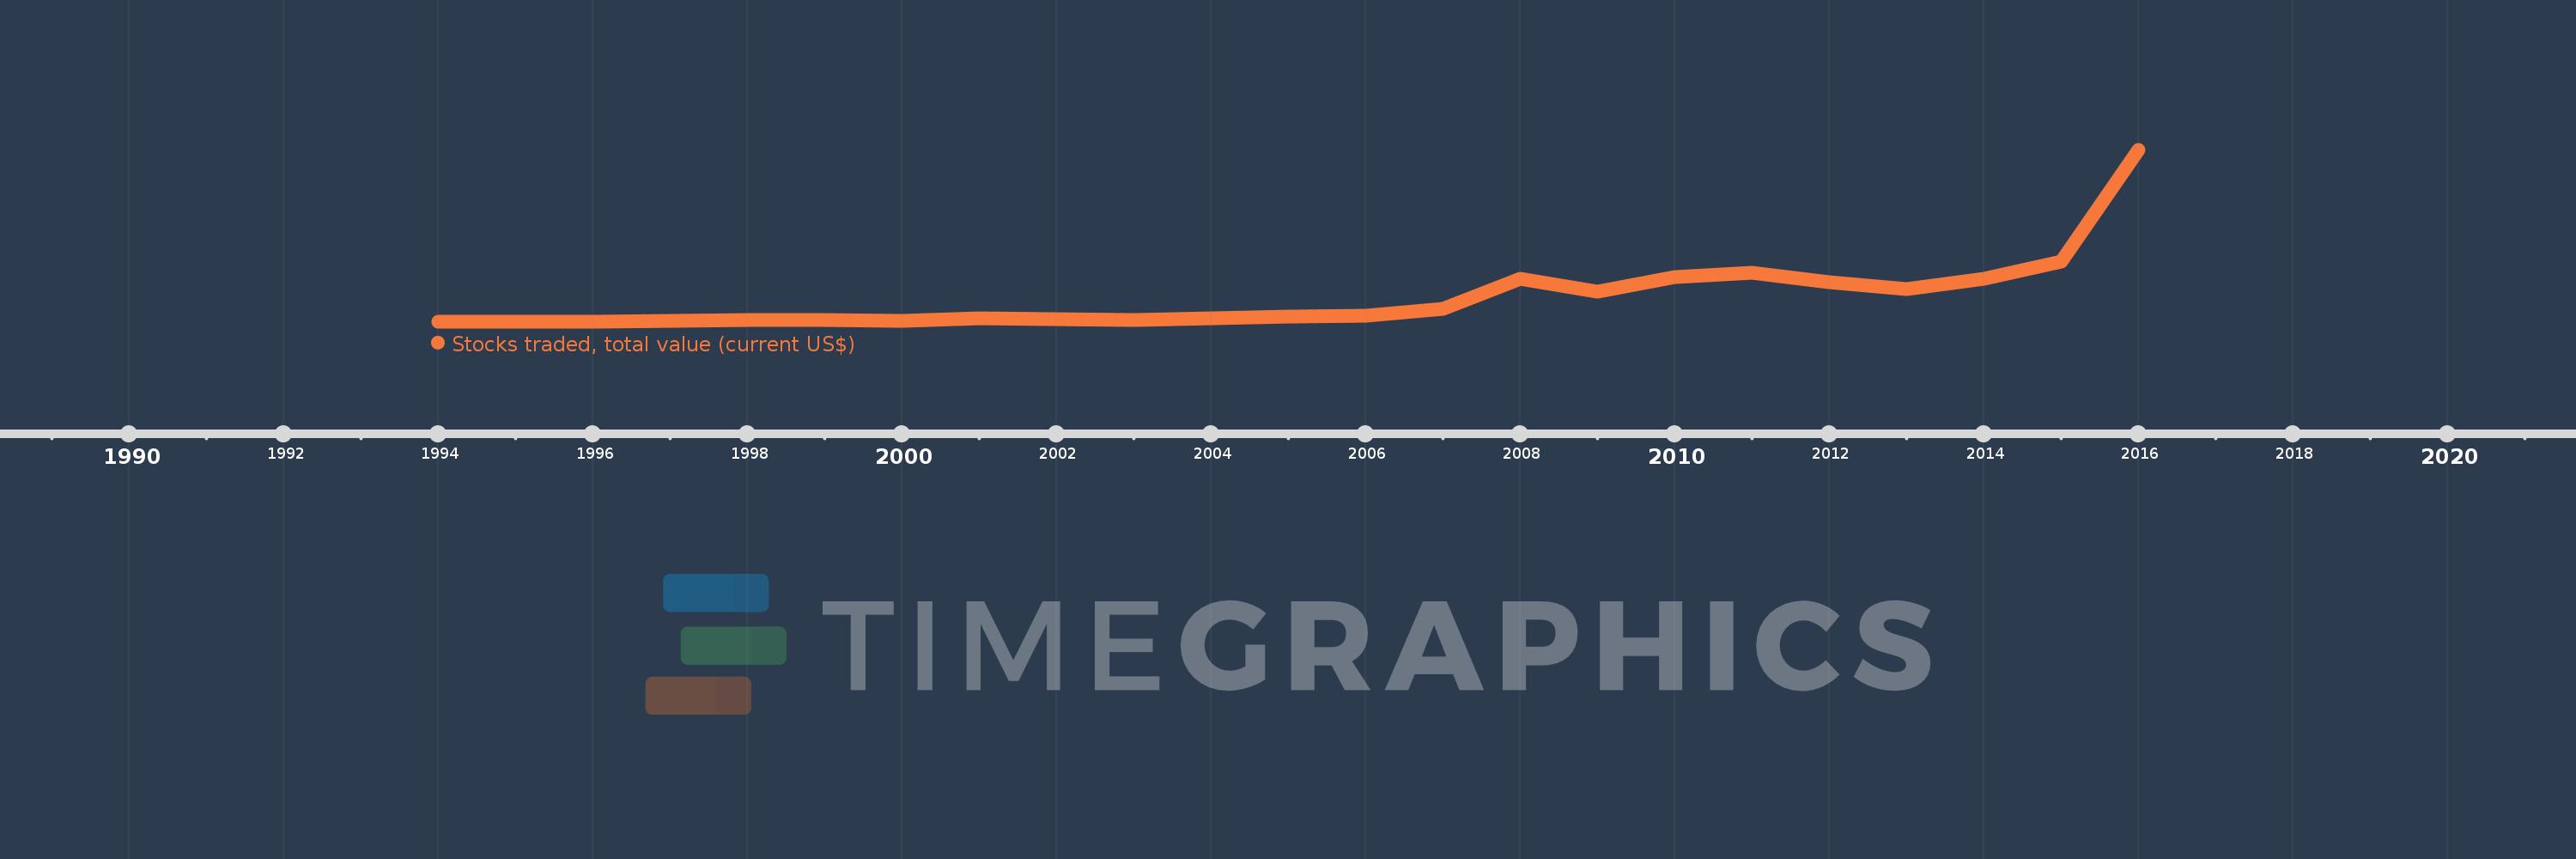
Questa scala temporale mostra un grafico dal 1994 anno al 2016 anno. IBRD only. I dati fino ad 1993 anno non disponibili. Il numero di osservazioni attuali secondo i date: 23.

La fonte (nome):

Indicatori dello sviluppo mondiale

La fonte (organizzazione):

World Federation of Exchanges database.

Categorie:

Financial Sector

sono stati aggiornati

23 apr 2017 anni

Indicatori delle variazioni dei valori per anni

In media:
6.24 Trln
Minima:
339.424 Mlrd
1 gen 1994 anni
Massimo:
41.94 Trln
1 gen 2016 anni
Alla data di osservazione
Valore
Variazione assoluta
La variazione rispetto al valore precedente
1 gen 1994 anni
339.424 Mlrd
+339.424 Mlrd
0.0%
1 gen 1995 anni
493.458 Mlrd
+154.034 Mlrd
45.38%
1 gen 1996 anni
461.642 Mlrd
-31.817 Mlrd
-6.45%
1 gen 1997 anni
671.006 Mlrd
+209.365 Mlrd
45.35%
1 gen 1998 anni
905.602 Mlrd
+234.595 Mlrd
34.96%
1 gen 1999 anni
731.06 Mlrd
-174.542 Mlrd
-19.27%
1 gen 2000 anni
704.851 Mlrd
-26.208 Mlrd
-3.58%
1 gen 2001 anni
1.292 Trln
+587.044 Mlrd
83.29%
1 gen 2002 anni
955.001 Mlrd
-336.895 Mlrd
-26.08%
1 gen 2003 anni
790.7 Mlrd
-164.3 Mlrd
-17.2%
1 gen 2004 anni
1.177 Trln
+386.421 Mlrd
48.87%
1 gen 2005 anni
1.671 Trln
+493.747 Mlrd
41.95%
1 gen 2006 anni
1.816 Trln
+145.606 Mlrd
8.71%
1 gen 2007 anni
3.57 Trln
+1.753 Trln
96.52%
1 gen 2008 anni
10.763 Trln
+7.193 Trln
201.51%
1 gen 2009 anni
7.611 Trln
-3.152 Trln
-29.28%
1 gen 2010 anni
11.296 Trln
+3.684 Trln
48.41%
1 gen 2011 anni
12.246 Trln
+950.394 Mlrd
8.41%
1 gen 2012 anni
10.069 Trln
-2.177 Trln
-17.78%
1 gen 2013 anni
8.203 Trln
-1.866 Trln
-18.53%
1 gen 2014 anni
10.823 Trln
+2.619 Trln
31.93%
1 gen 2015 anni
14.994 Trln
+4.171 Trln
38.54%
1 gen 2016 anni
41.94 Trln
+26.946 Trln
179.71%

Classificazione dei paesi secondo i statistiche attuali per anni