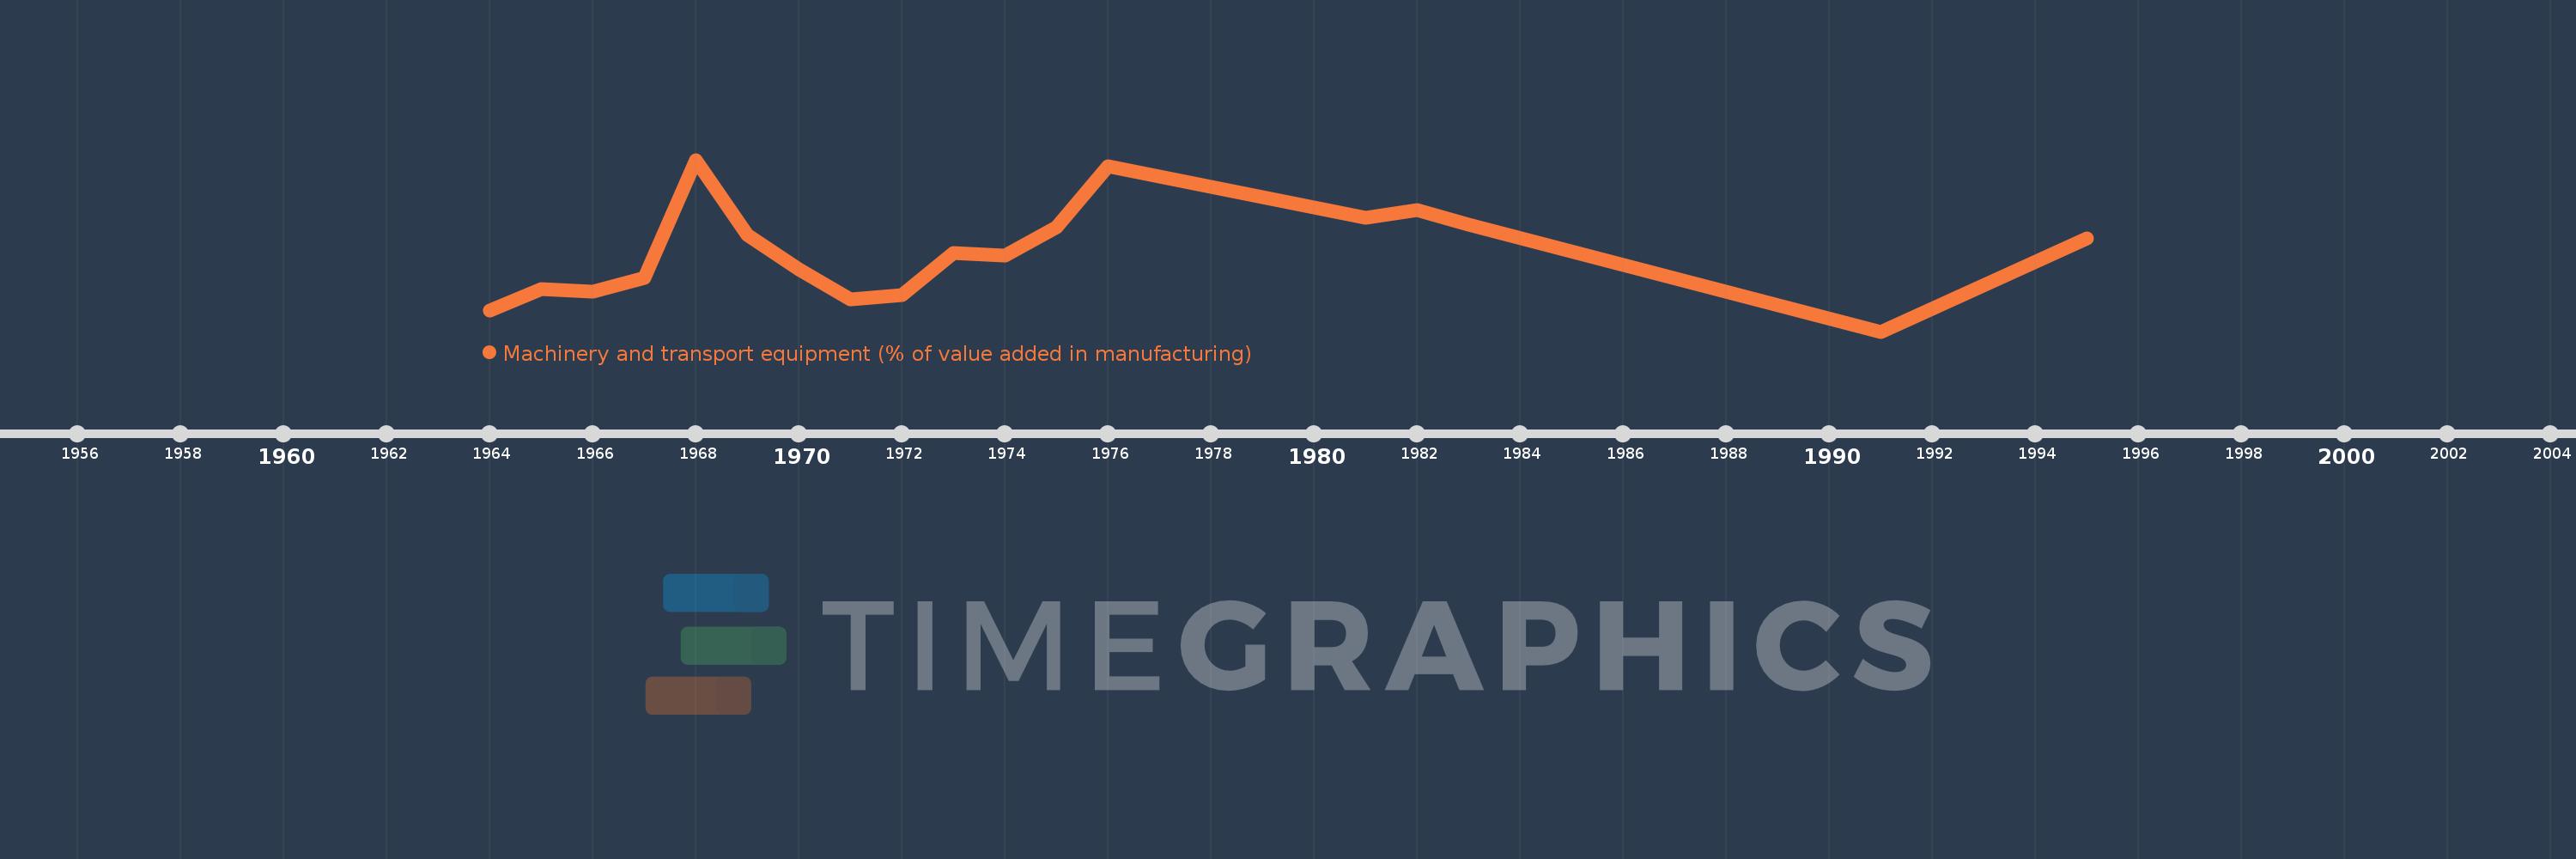
Questa scala temporale mostra un grafico dal 1964 anno al 1995 anno. Zambia. I dati fino ad 1963 anno non disponibili. Il numero di osservazioni attuali secondo i date: 18.
La fonte (nome):
Indicatori dello sviluppo mondiale
La fonte (organizzazione):
United Nations Industrial Development Organization, International Yearbook of Industrial Statistics.
Categorie:
Economy & Growth
sono stati aggiornati
23 apr 2017 anni
Indicatori delle variazioni dei valori per anni
In media:
4.83
Minima:
2.443
1 gen 1991 anni
Massimo:
7.661
1 gen 1968 anni
Alla data di osservazione
Valore
Variazione assoluta
La variazione rispetto al valore precedente
1 gen 1964 anni
3.085
+3.085
0.0%
1 gen 1965 anni
3.735
+0.65
21.08%
1 gen 1966 anni
3.646
-0.089
-2.38%
1 gen 1967 anni
4.065
+0.419
11.5%
1 gen 1968 anni
7.661
+3.596
88.45%
1 gen 1969 anni
5.37
-2.291
-29.9%
1 gen 1970 anni
4.324
-1.046
-19.47%
1 gen 1971 anni
3.423
-0.901
-20.83%
1 gen 1972 anni
3.541
+0.117
3.43%
1 gen 1973 anni
4.835
+1.294
36.55%
1 gen 1974 anni
4.76
-0.075
-1.54%
1 gen 1975 anni
5.61
+0.85
17.85%
1 gen 1976 anni
7.456
+1.846
32.9%
1 gen 1981 anni
5.895
-1.561
-20.94%
1 gen 1982 anni
6.142
+0.247
4.19%
1 gen 1983 anni
5.688
-0.454
-7.39%
1 gen 1991 anni
2.443
-3.245
-57.05%
1 gen 1995 anni
5.268
+2.824
115.6%
Classificazione dei paesi secondo i statistiche attuali per anni