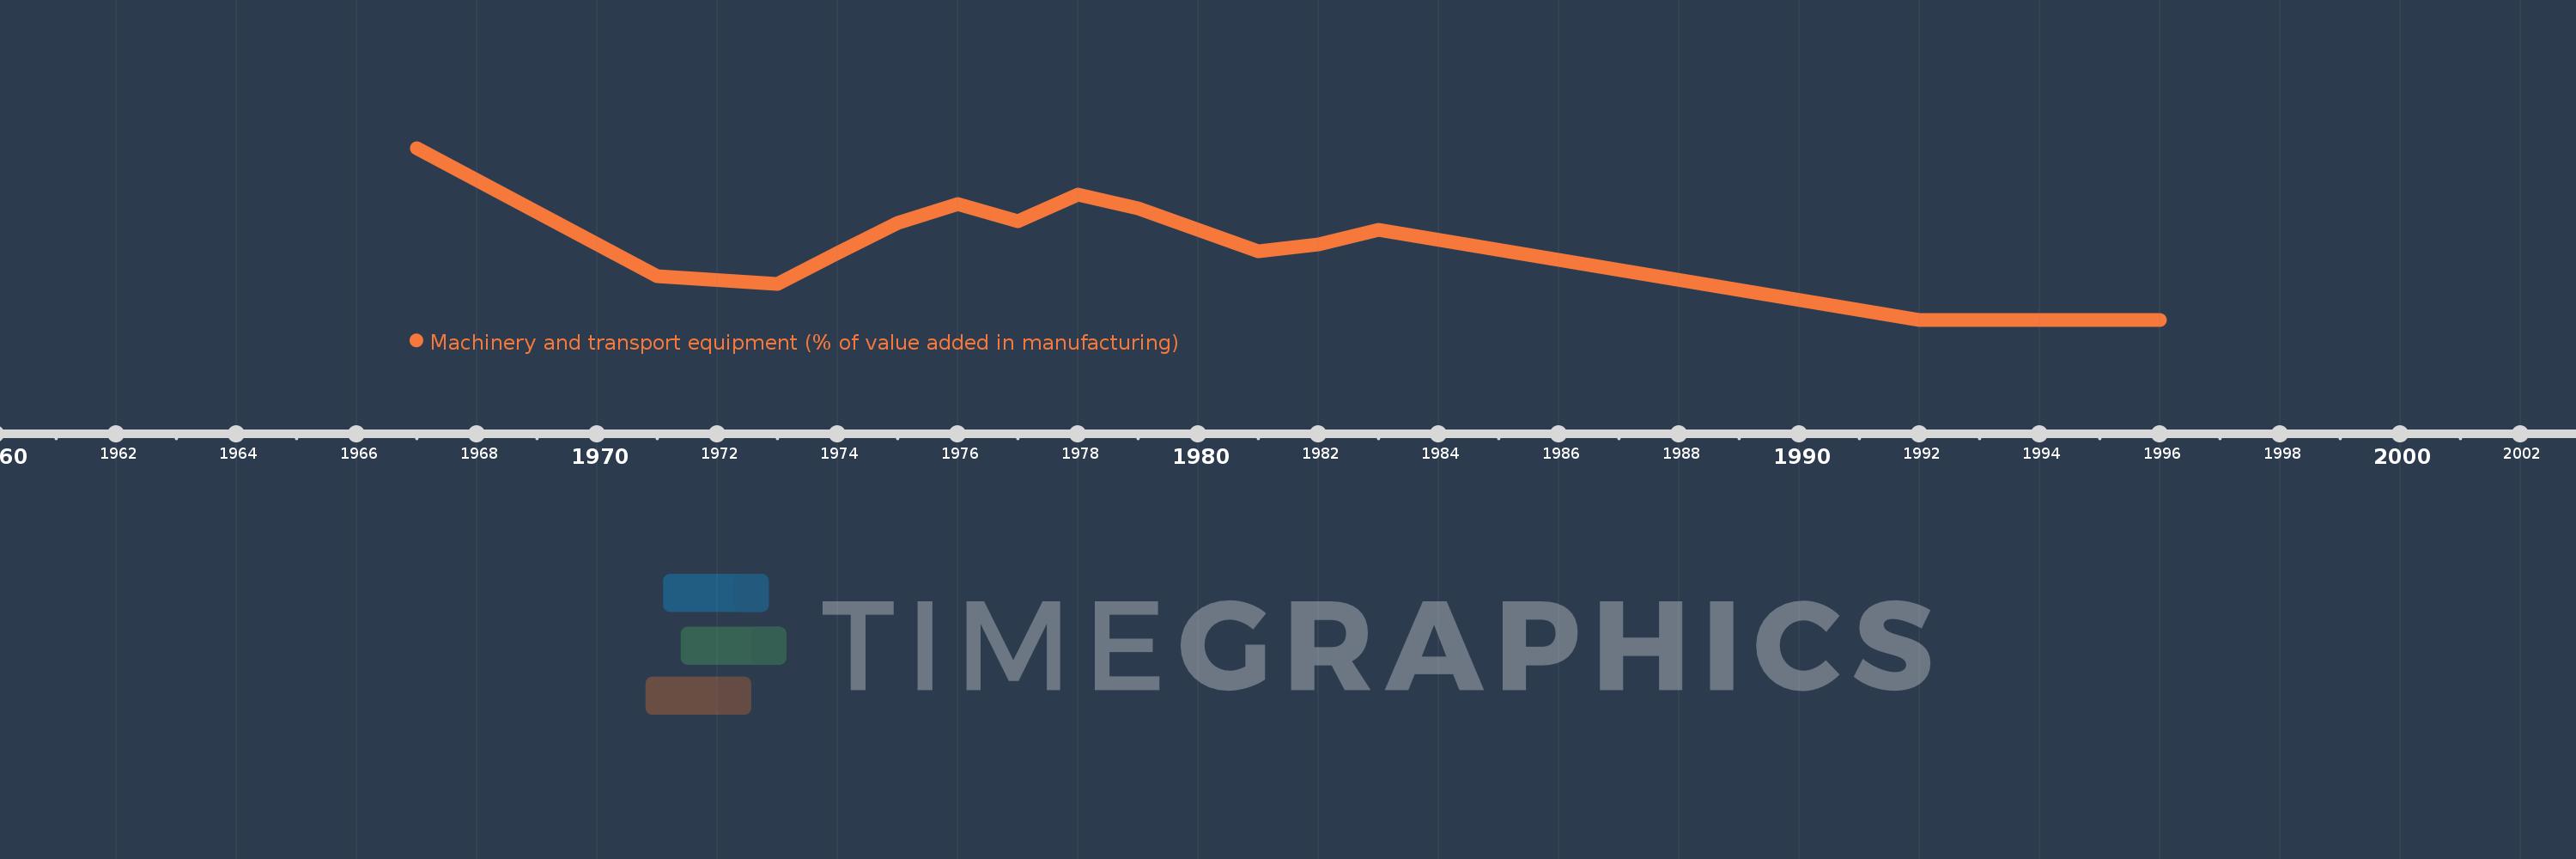
Questa scala temporale mostra un grafico dal 1967 anno al 1996 anno. Gabon. I dati fino ad 1966 anno non disponibili. Il numero di osservazioni attuali secondo i date: 17.
La fonte (nome):
Indicatori dello sviluppo mondiale
La fonte (organizzazione):
United Nations Industrial Development Organization, International Yearbook of Industrial Statistics.
Categorie:
Economy & Growth
sono stati aggiornati
23 apr 2017 anni
Indicatori delle variazioni dei valori per anni
In media:
5.349
Minima:
0.0
1 gen 1992 anni
Massimo:
14.219
1 gen 1967 anni
Alla data di osservazione
Valore
Variazione assoluta
La variazione rispetto al valore precedente
1 gen 1967 anni
14.219
+14.219
0.0%
1 gen 1971 anni
3.613
-10.606
-74.59%
1 gen 1973 anni
2.933
-0.68
-18.82%
1 gen 1974 anni
5.557
+2.624
89.47%
1 gen 1975 anni
8.031
+2.474
44.51%
1 gen 1976 anni
9.561
+1.53
19.05%
1 gen 1977 anni
8.155
-1.406
-14.7%
1 gen 1978 anni
10.326
+2.171
26.62%
1 gen 1979 anni
9.229
-1.097
-10.62%
1 gen 1981 anni
5.632
-3.597
-38.98%
1 gen 1982 anni
6.222
+0.59
10.48%
1 gen 1983 anni
7.449
+1.227
19.72%
1 gen 1992 anni
0.0
-7.449
-100.0%
1 gen 1993 anni
0.0
0.0
%
1 gen 1994 anni
0.0
0.0
%
1 gen 1995 anni
0.0
0.0
%
1 gen 1996 anni
0.0
0.0
%
Classificazione dei paesi secondo i statistiche attuali per anni