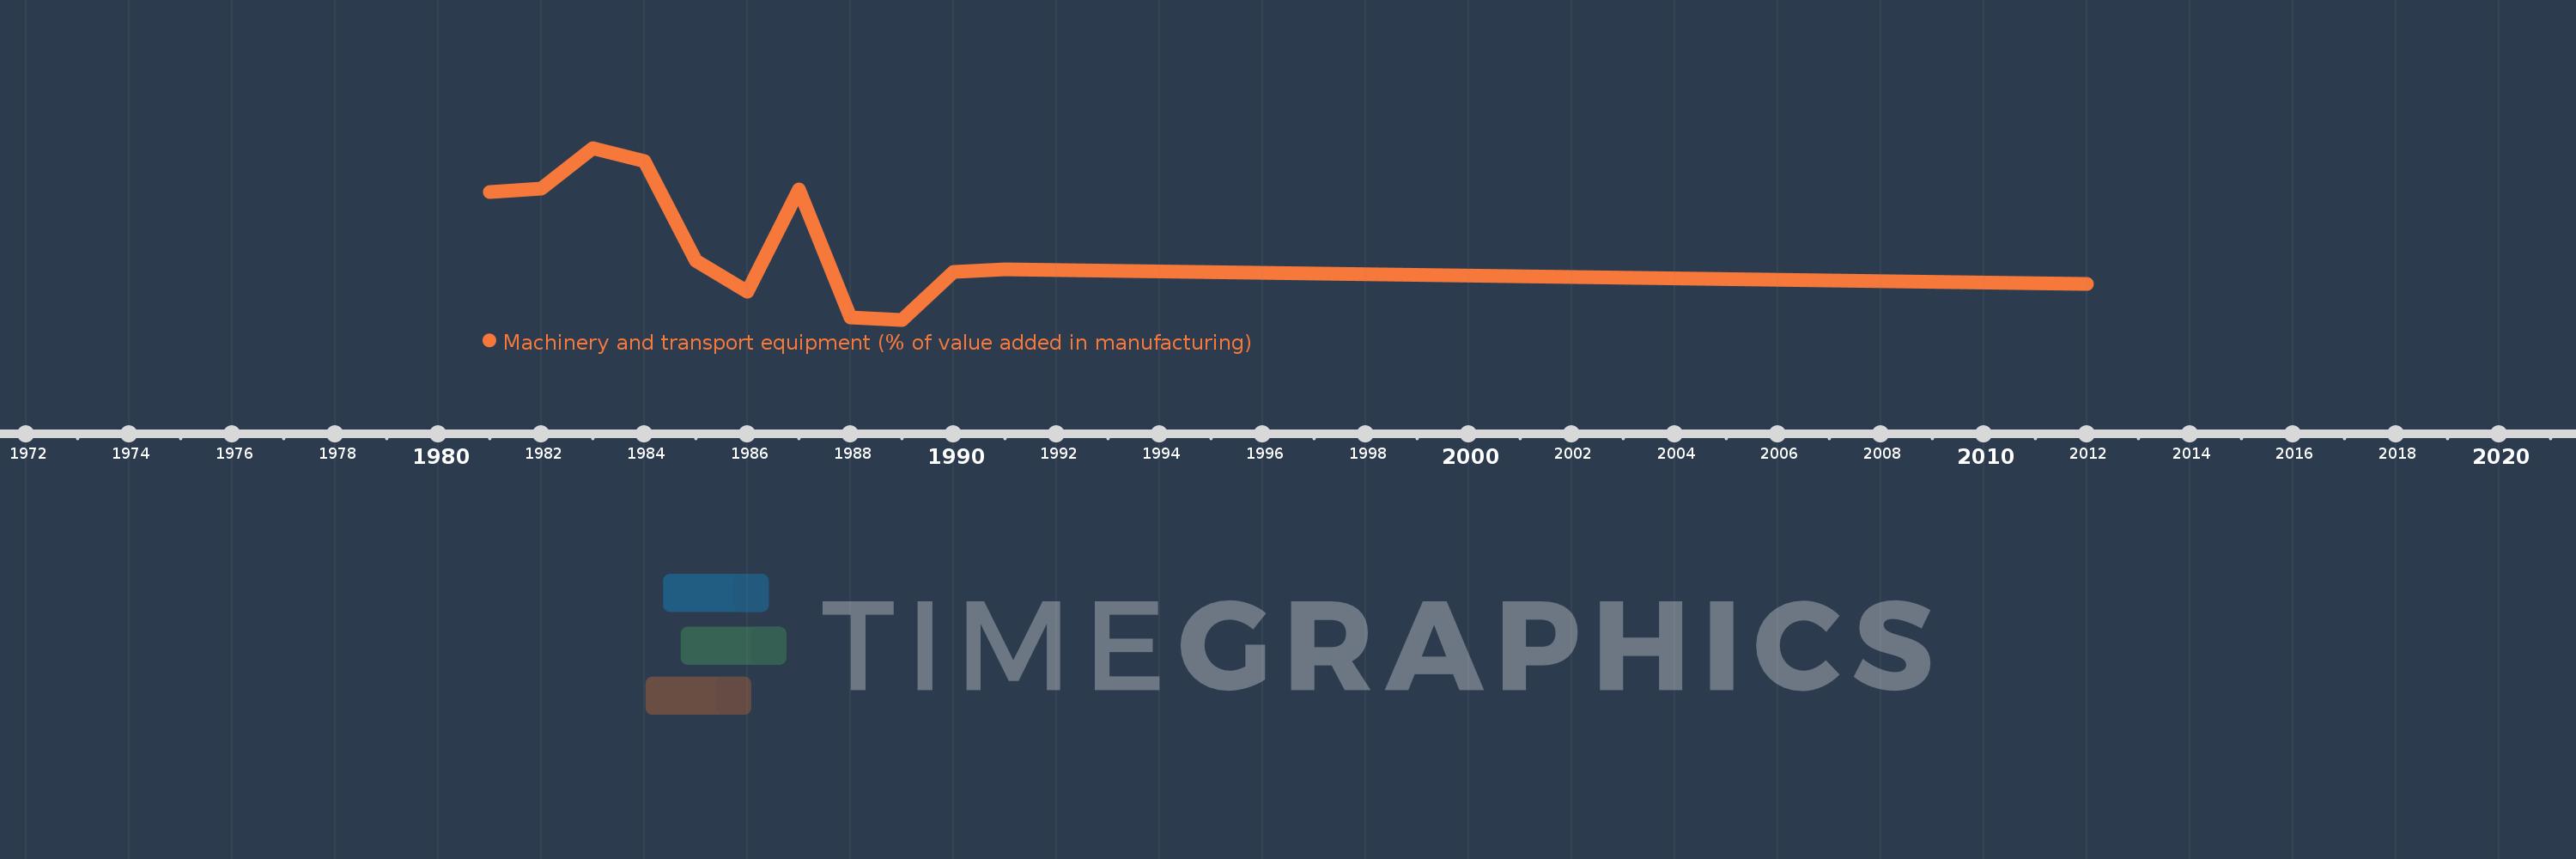
Questa scala temporale mostra un grafico dal 1981 anno al 2012 anno. Swaziland. I dati fino ad 1980 anno non disponibili. Il numero di osservazioni attuali secondo i date: 12.
La fonte (nome):
Indicatori dello sviluppo mondiale
La fonte (organizzazione):
United Nations Industrial Development Organization, International Yearbook of Industrial Statistics.
Categorie:
Economy & Growth
sono stati aggiornati
23 apr 2017 anni
Indicatori delle variazioni dei valori per anni
In media:
1.252
Minima:
0.179
1 gen 1989 anni
Massimo:
2.526
1 gen 1983 anni
Alla data di osservazione
Valore
Variazione assoluta
La variazione rispetto al valore precedente
1 gen 1981 anni
1.919
+1.919
0.0%
1 gen 1982 anni
1.968
+0.049
2.55%
1 gen 1983 anni
2.526
+0.558
28.36%
1 gen 1984 anni
2.351
-0.175
-6.93%
1 gen 1985 anni
0.98
-1.371
-58.33%
1 gen 1986 anni
0.563
-0.416
-42.5%
1 gen 1987 anni
1.956
+1.393
247.35%
1 gen 1988 anni
0.215
-1.741
-89.0%
1 gen 1989 anni
0.179
-0.036
-16.69%
1 gen 1990 anni
0.829
+0.649
362.21%
1 gen 1991 anni
0.87
+0.041
4.97%
1 gen 2012 anni
0.673
-0.197
-22.61%
Classificazione dei paesi secondo i statistiche attuali per anni