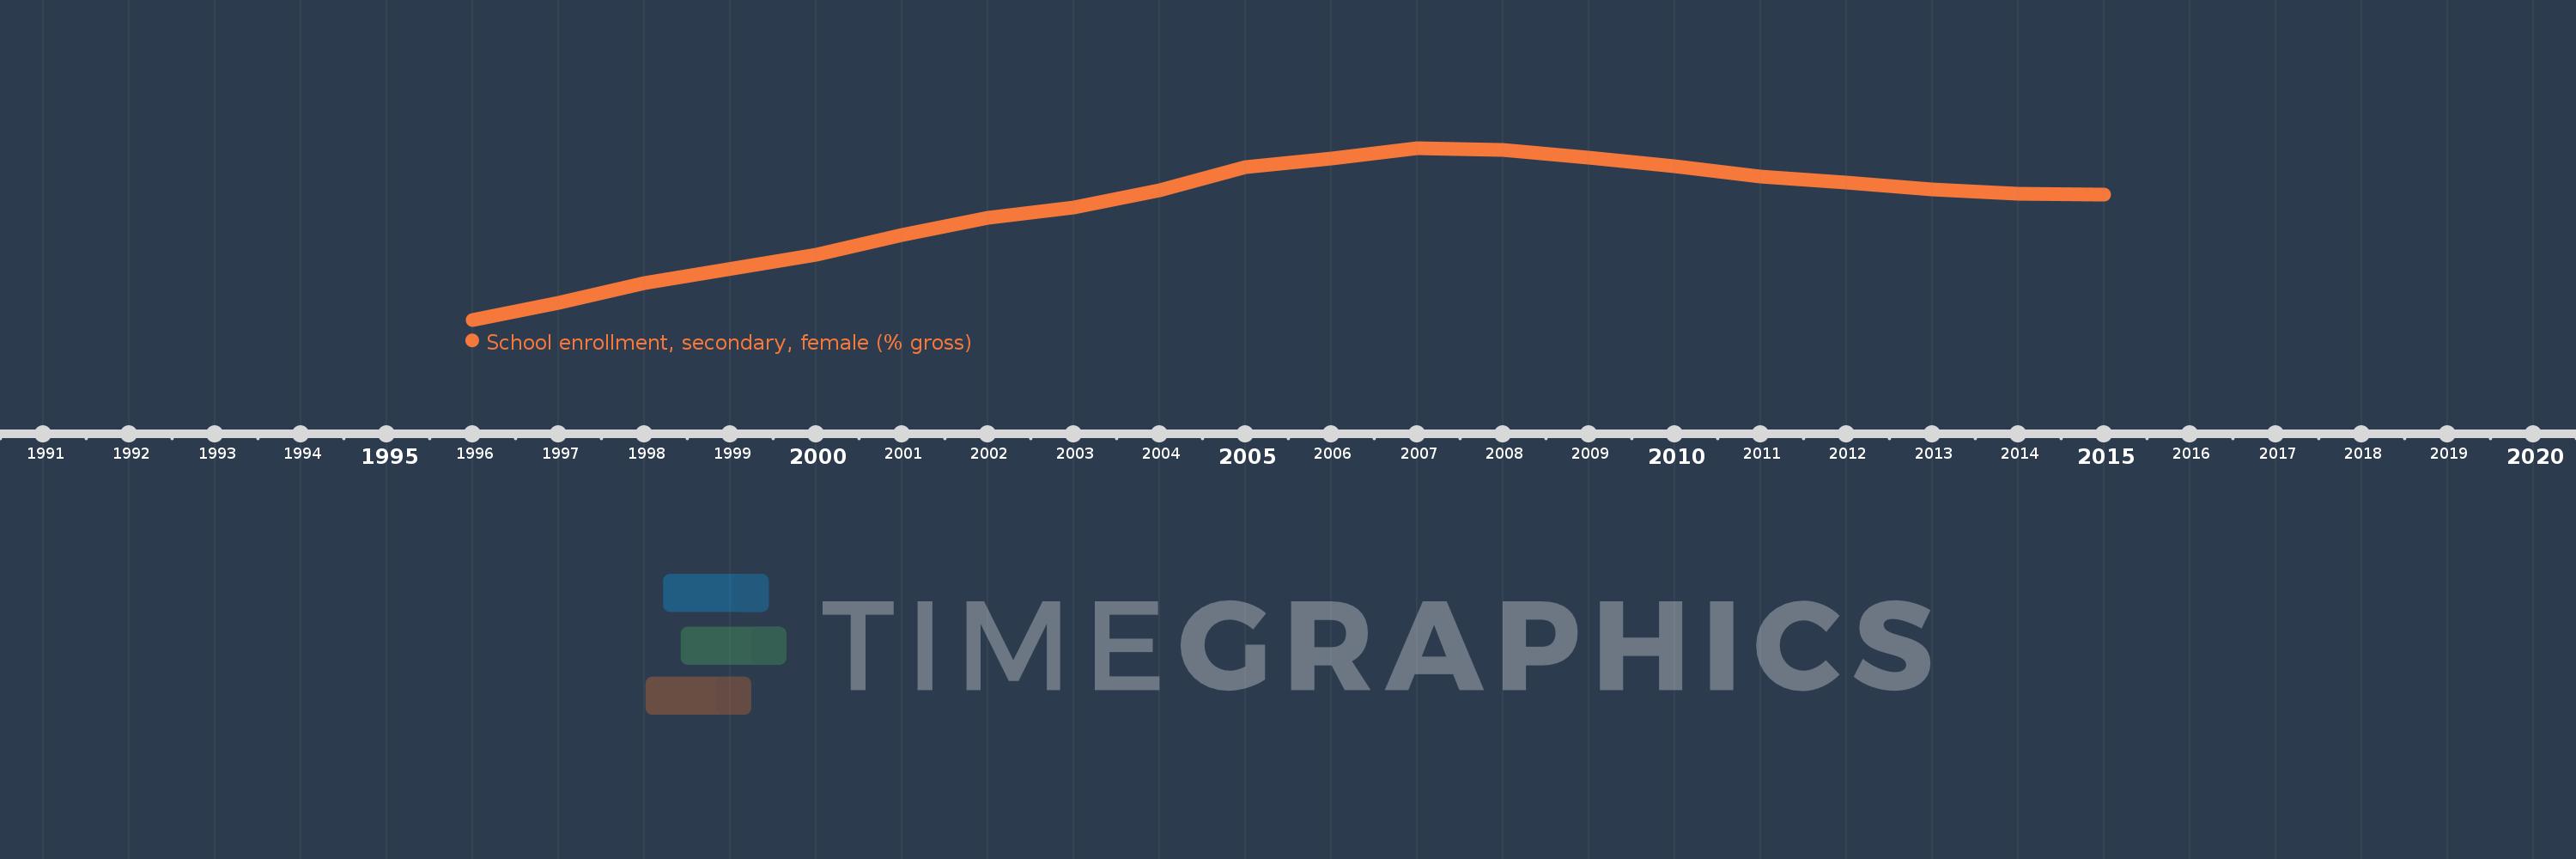
Questa scala temporale mostra un grafico dal 1996 anno al 2015 anno. West Bank and Gaza. I dati fino ad 1995 anno non disponibili. Il numero di osservazioni attuali secondo i date: 19.
La fonte (nome):
Indicatori dello sviluppo mondiale
La fonte (organizzazione):
United Nations Educational, Scientific, and Cultural Organization (UNESCO) Institute for Statistics.
Categorie:
Education, Gender
sono stati aggiornati
23 apr 2017 anni
Indicatori delle variazioni dei valori per anni
In media:
84.613
Minima:
67.122
1 gen 1996 anni
Massimo:
93.327
1 gen 2007 anni
Alla data di osservazione
Valore
Variazione assoluta
La variazione rispetto al valore precedente
1 gen 1996 anni
67.122
+67.122
0.0%
1 gen 1997 anni
69.709
+2.586
3.85%
1 gen 1998 anni
72.66
+2.951
4.23%
1 gen 2000 anni
77.069
+4.41
6.07%
1 gen 2001 anni
80.008
+2.938
3.81%
1 gen 2002 anni
82.614
+2.606
3.26%
1 gen 2003 anni
84.291
+1.677
2.03%
1 gen 2004 anni
86.817
+2.526
3.0%
1 gen 2005 anni
90.399
+3.581
4.12%
1 gen 2006 anni
91.67
+1.272
1.41%
1 gen 2007 anni
93.327
+1.657
1.81%
1 gen 2008 anni
93.058
-0.269
-0.29%
1 gen 2009 anni
91.838
-1.219
-1.31%
1 gen 2010 anni
90.514
-1.324
-1.44%
1 gen 2011 anni
88.975
-1.54
-1.7%
1 gen 2012 anni
88.054
-0.921
-1.03%
1 gen 2013 anni
86.957
-1.097
-1.25%
1 gen 2014 anni
86.394
-0.563
-0.65%
1 gen 2015 anni
86.171
-0.223
-0.26%
Classificazione dei paesi secondo i statistiche attuali per anni