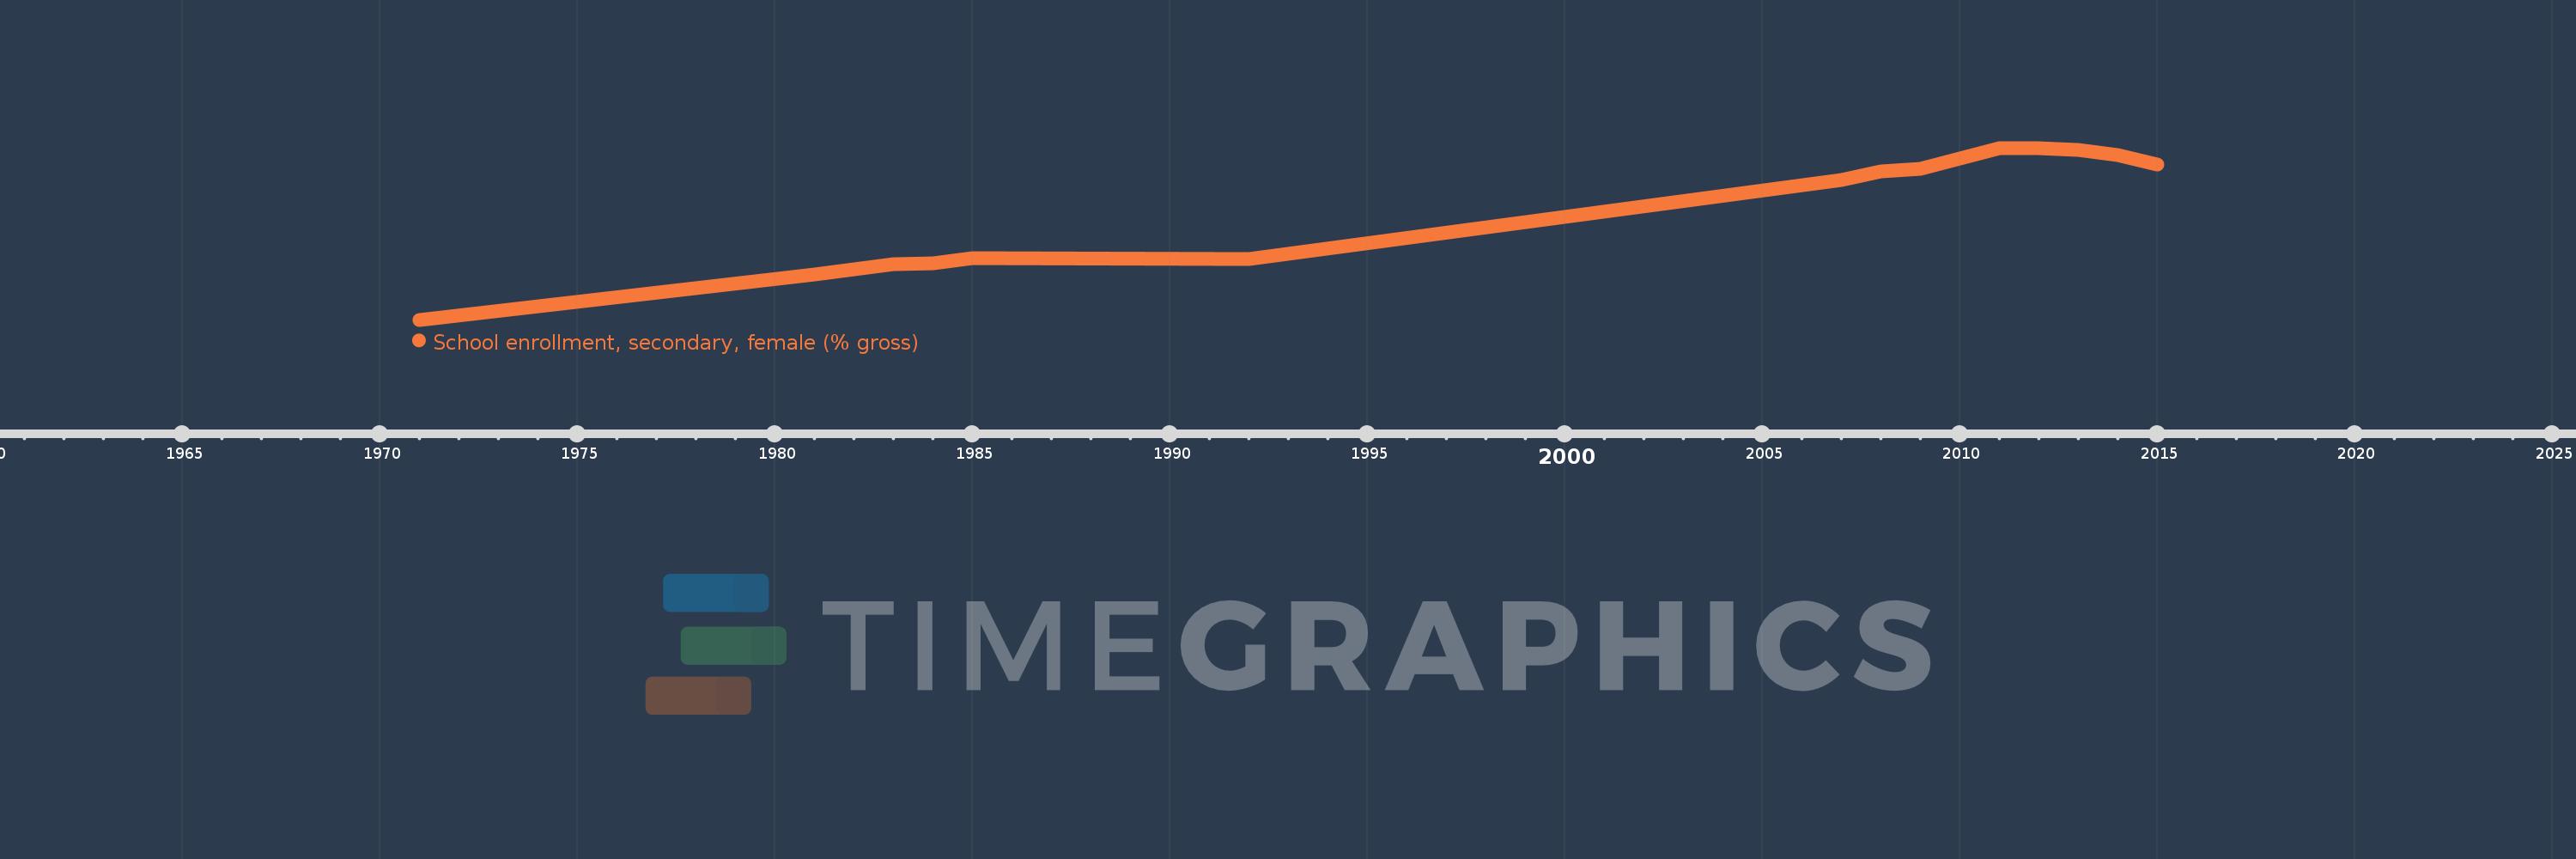
Questa scala temporale mostra un grafico dal 1971 anno al 2015 anno. Honduras. I dati fino ad 1970 anno non disponibili. Il numero di osservazioni attuali secondo i date: 14.
La fonte (nome):
Indicatori dello sviluppo mondiale
La fonte (organizzazione):
United Nations Educational, Scientific, and Cultural Organization (UNESCO) Institute for Statistics.
Categorie:
Education, Gender
sono stati aggiornati
23 apr 2017 anni
Indicatori delle variazioni dei valori per anni
In media:
56.057
Minima:
12.142
1 gen 1971 anni
Massimo:
80.215
1 gen 2012 anni
Alla data di osservazione
Valore
Variazione assoluta
La variazione rispetto al valore precedente
1 gen 1971 anni
12.142
+12.142
0.0%
1 gen 1981 anni
29.914
+17.772
146.37%
1 gen 1983 anni
34.32
+4.406
14.73%
1 gen 1984 anni
34.507
+0.187
0.55%
1 gen 1985 anni
36.518
+2.01
5.83%
1 gen 1992 anni
36.369
-0.148
-0.41%
1 gen 2007 anni
67.675
+31.305
86.08%
1 gen 2008 anni
70.764
+3.089
4.56%
1 gen 2009 anni
71.822
+1.058
1.5%
1 gen 2011 anni
79.993
+8.171
11.38%
1 gen 2012 anni
80.215
+0.222
0.28%
1 gen 2013 anni
79.471
-0.745
-0.93%
1 gen 2014 anni
77.352
-2.118
-2.67%
1 gen 2015 anni
73.733
-3.62
-4.68%
Classificazione dei paesi secondo i statistiche attuali per anni