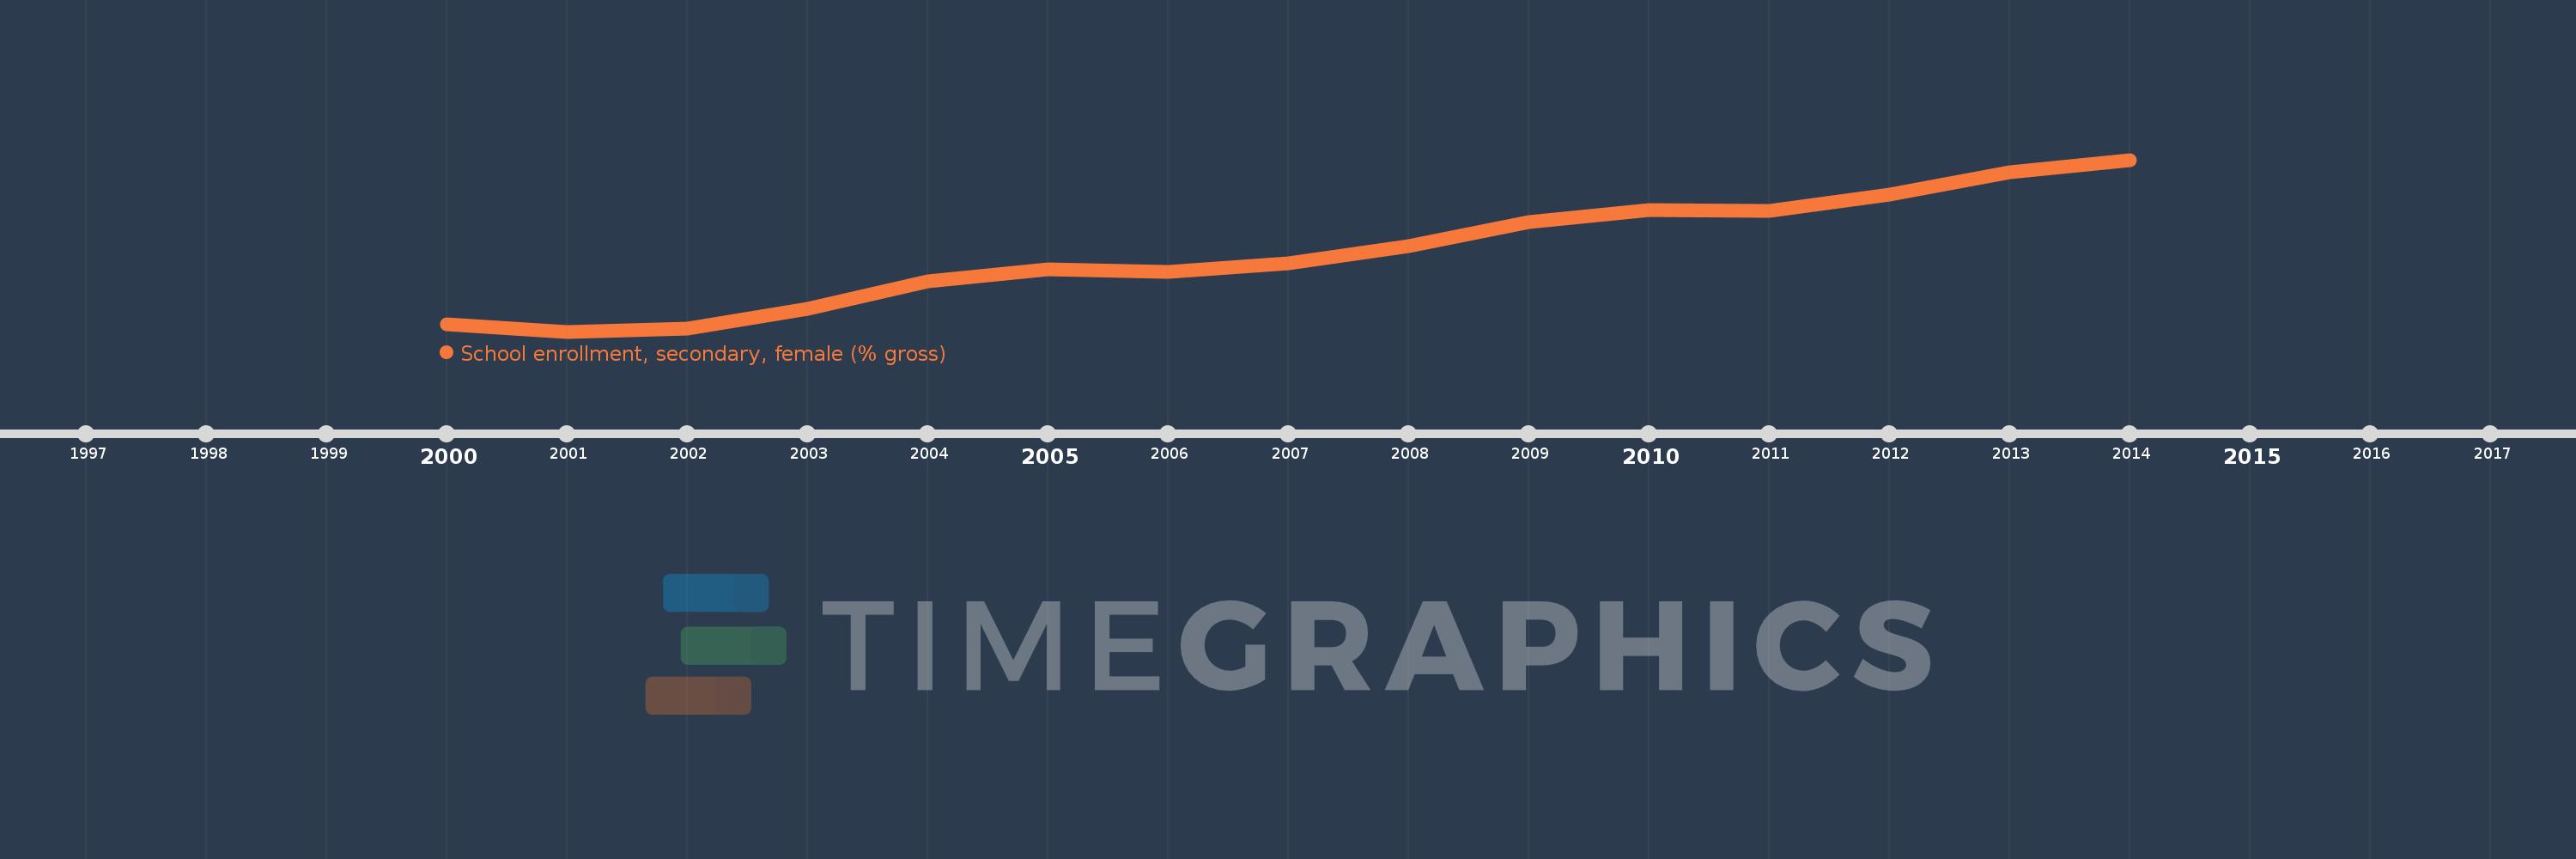
Questa scala temporale mostra un grafico dal 2000 anno al 2014 anno. Tajikistan. I dati fino ad 1999 anno non disponibili. Il numero di osservazioni attuali secondo i date: 15.
La fonte (nome):
Indicatori dello sviluppo mondiale
La fonte (organizzazione):
United Nations Educational, Scientific, and Cultural Organization (UNESCO) Institute for Statistics.
Categorie:
Education, Gender
sono stati aggiornati
23 apr 2017 anni
Indicatori delle variazioni dei valori per anni
In media:
74.635
Minima:
67.494
1 gen 2001 anni
Massimo:
83.115
1 gen 2014 anni
Alla data di osservazione
Valore
Variazione assoluta
La variazione rispetto al valore precedente
1 gen 2000 anni
68.127
+68.127
0.0%
1 gen 2001 anni
67.494
-0.633
-0.93%
1 gen 2002 anni
67.764
+0.27
0.4%
1 gen 2003 anni
69.534
+1.77
2.61%
1 gen 2004 anni
72.052
+2.519
3.62%
1 gen 2005 anni
73.157
+1.105
1.53%
1 gen 2006 anni
72.923
-0.234
-0.32%
1 gen 2007 anni
73.705
+0.782
1.07%
1 gen 2008 anni
75.283
+1.578
2.14%
1 gen 2009 anni
77.467
+2.184
2.9%
1 gen 2010 anni
78.512
+1.045
1.35%
1 gen 2011 anni
78.462
-0.049
-0.06%
1 gen 2012 anni
79.981
+1.519
1.94%
1 gen 2013 anni
81.958
+1.978
2.47%
1 gen 2014 anni
83.115
+1.156
1.41%
Classificazione dei paesi secondo i statistiche attuali per anni