Download Queste statistiche in altri paesi:
Linea del tempo:
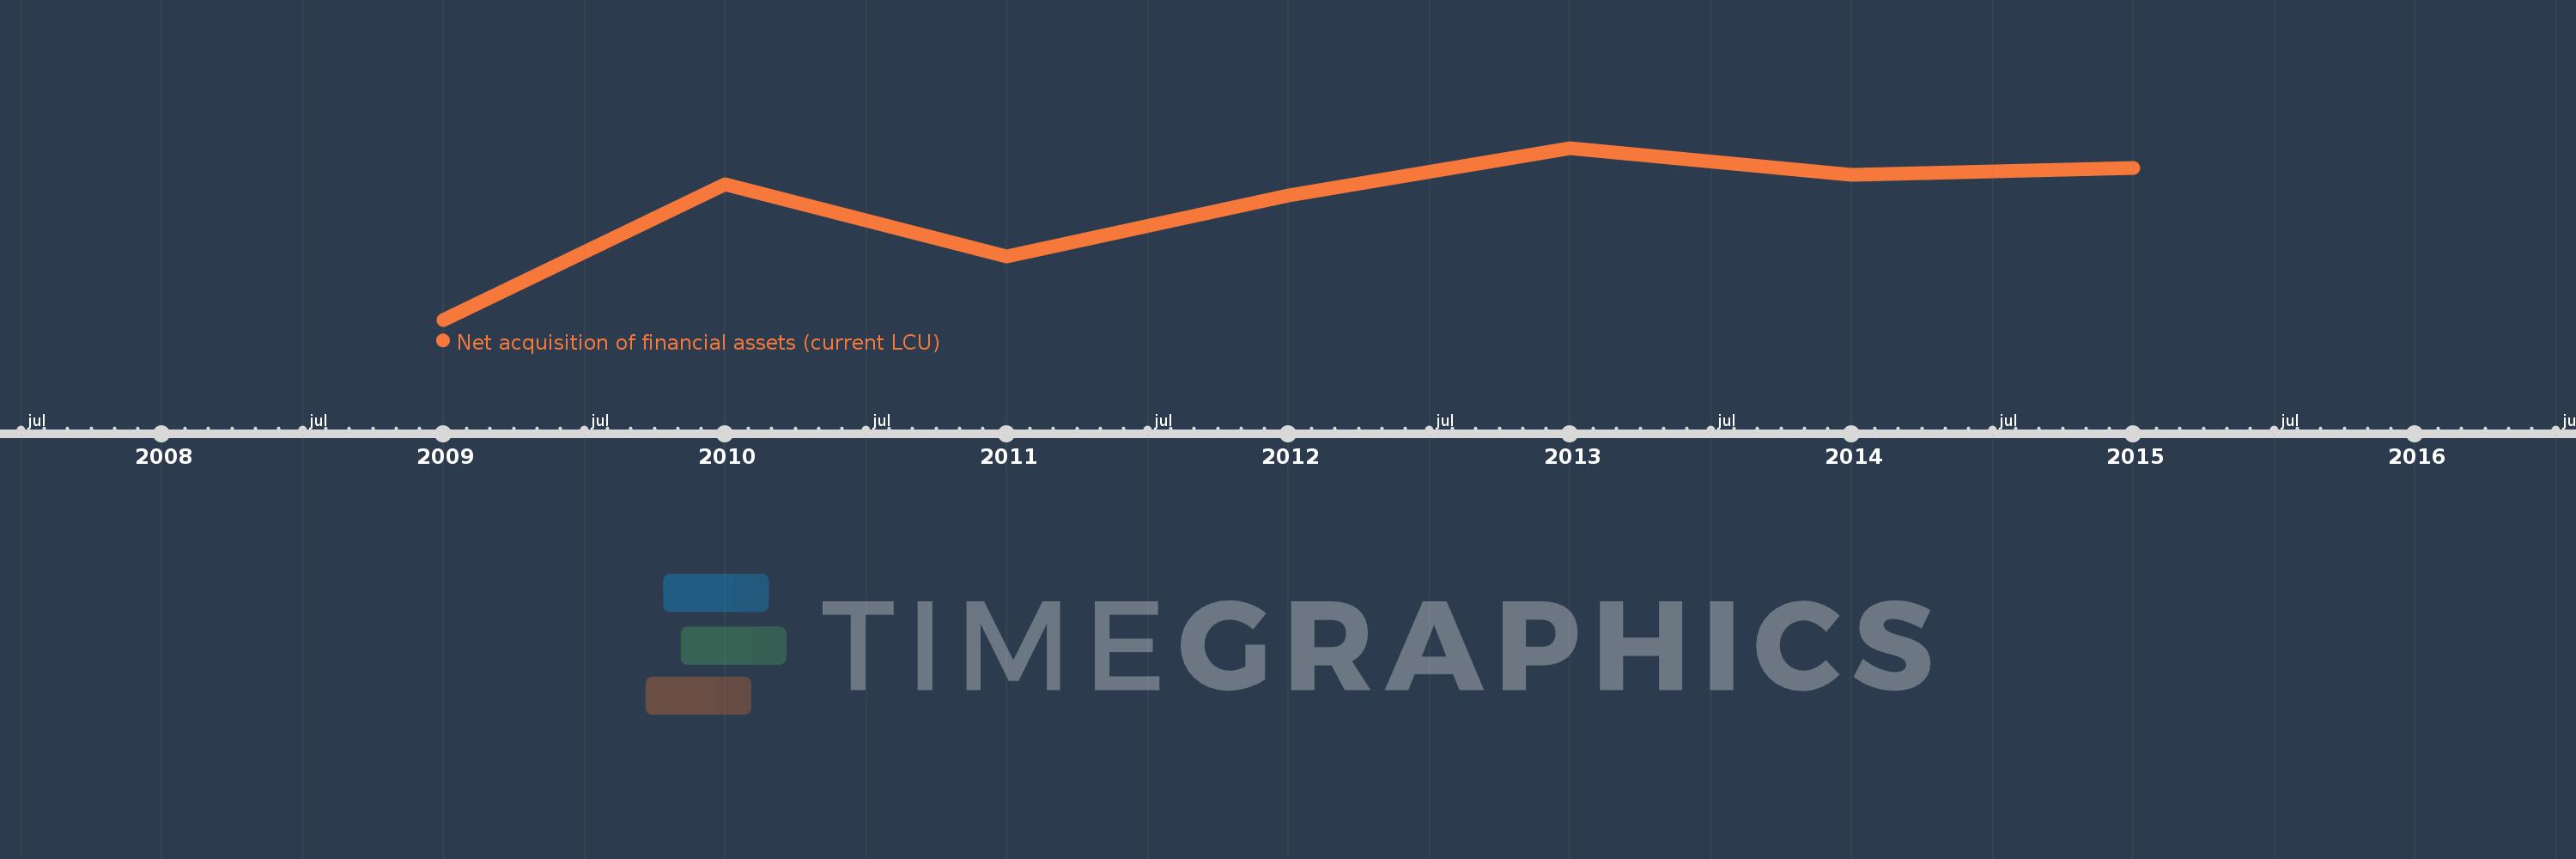
Questa scala temporale mostra un grafico dal 2009 anno al 2015 anno. Turkey. I dati fino ad 2008 anno non disponibili. Il numero di osservazioni attuali secondo i date: 7.
La fonte (nome):
Indicatori dello sviluppo mondiale
La fonte (organizzazione):
International Monetary Fund, Government Finance Statistics Yearbook and data files.
Categorie:
Public Sector
sono stati aggiornati
23 apr 2017 anni
Indicatori delle variazioni dei valori per anni
Minima:
-11.17 Mlrd
1 gen 2009 anni
Massimo:
28.723 Mlrd
1 gen 2013 anni
Alla data di osservazione
Valore
Variazione assoluta
La variazione rispetto al valore precedente
1 gen 2009 anni
-11.17 Mlrd
-11.17 Mlrd
0.0%
1 gen 2010 anni
20.192 Mlrd
+31.362 Mlrd
-280.78%
1 gen 2011 anni
3.519 Mlrd
-16.674 Mlrd
-82.57%
1 gen 2012 anni
17.751 Mlrd
+14.232 Mlrd
404.48%
1 gen 2013 anni
28.723 Mlrd
+10.972 Mlrd
61.81%
1 gen 2014 anni
22.538 Mlrd
-6.184 Mlrd
-21.53%
1 gen 2015 anni
24.167 Mlrd
+1.629 Mlrd
7.23%
Classificazione dei paesi secondo i statistiche attuali per anni