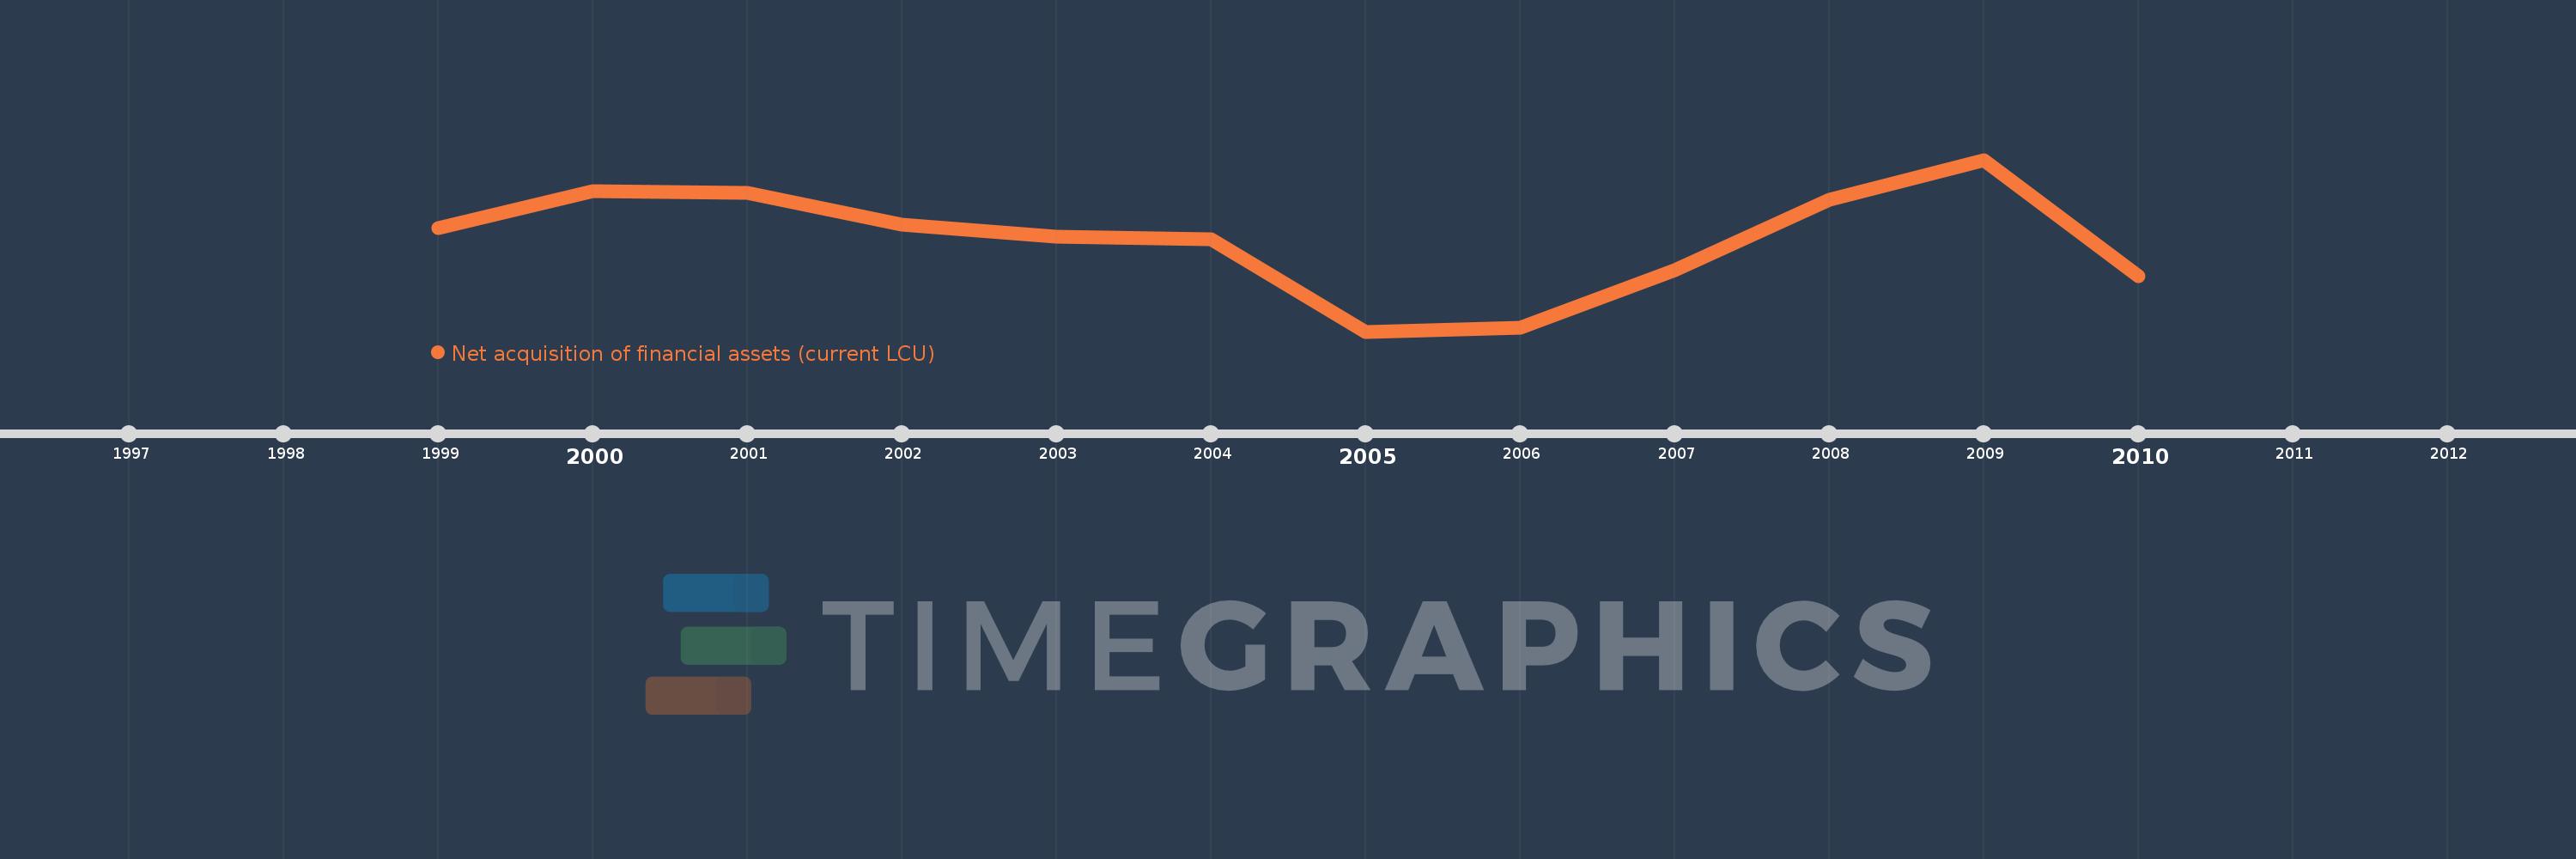
Questa scala temporale mostra un grafico dal 1999 anno al 2010 anno. Syrian Arab Republic. I dati fino ad 1998 anno non disponibili. Il numero di osservazioni attuali secondo i date: 12.
La fonte (nome):
Indicatori dello sviluppo mondiale
La fonte (organizzazione):
International Monetary Fund, Government Finance Statistics Yearbook and data files.
Categorie:
Public Sector
sono stati aggiornati
23 apr 2017 anni
Indicatori delle variazioni dei valori per anni
In media:
8.172 Mlrd
Minima:
-59.729 Mlrd
1 gen 2005 anni
Massimo:
67.481 Mlrd
1 gen 2009 anni
Alla data di osservazione
Valore
Variazione assoluta
La variazione rispetto al valore precedente
1 gen 1999 anni
17.071 Mlrd
+17.071 Mlrd
0.0%
1 gen 2000 anni
44.265 Mlrd
+27.194 Mlrd
159.3%
1 gen 2001 anni
42.943 Mlrd
-1.322 Mlrd
-2.99%
1 gen 2002 anni
19.409 Mlrd
-23.534 Mlrd
-54.8%
1 gen 2003 anni
10.527 Mlrd
-8.882 Mlrd
-45.76%
1 gen 2004 anni
8.518 Mlrd
-2.009 Mlrd
-19.08%
1 gen 2005 anni
-59.729 Mlrd
-68.247 Mlrd
-801.21%
1 gen 2006 anni
-56.879 Mlrd
+2.85 Mlrd
-4.77%
1 gen 2007 anni
-14.437 Mlrd
+42.442 Mlrd
-74.62%
1 gen 2008 anni
37.636 Mlrd
+52.073 Mlrd
-360.69%
1 gen 2009 anni
67.481 Mlrd
+29.845 Mlrd
79.3%
1 gen 2010 anni
-18.736 Mlrd
-86.217 Mlrd
-127.76%
Classificazione dei paesi secondo i statistiche attuali per anni