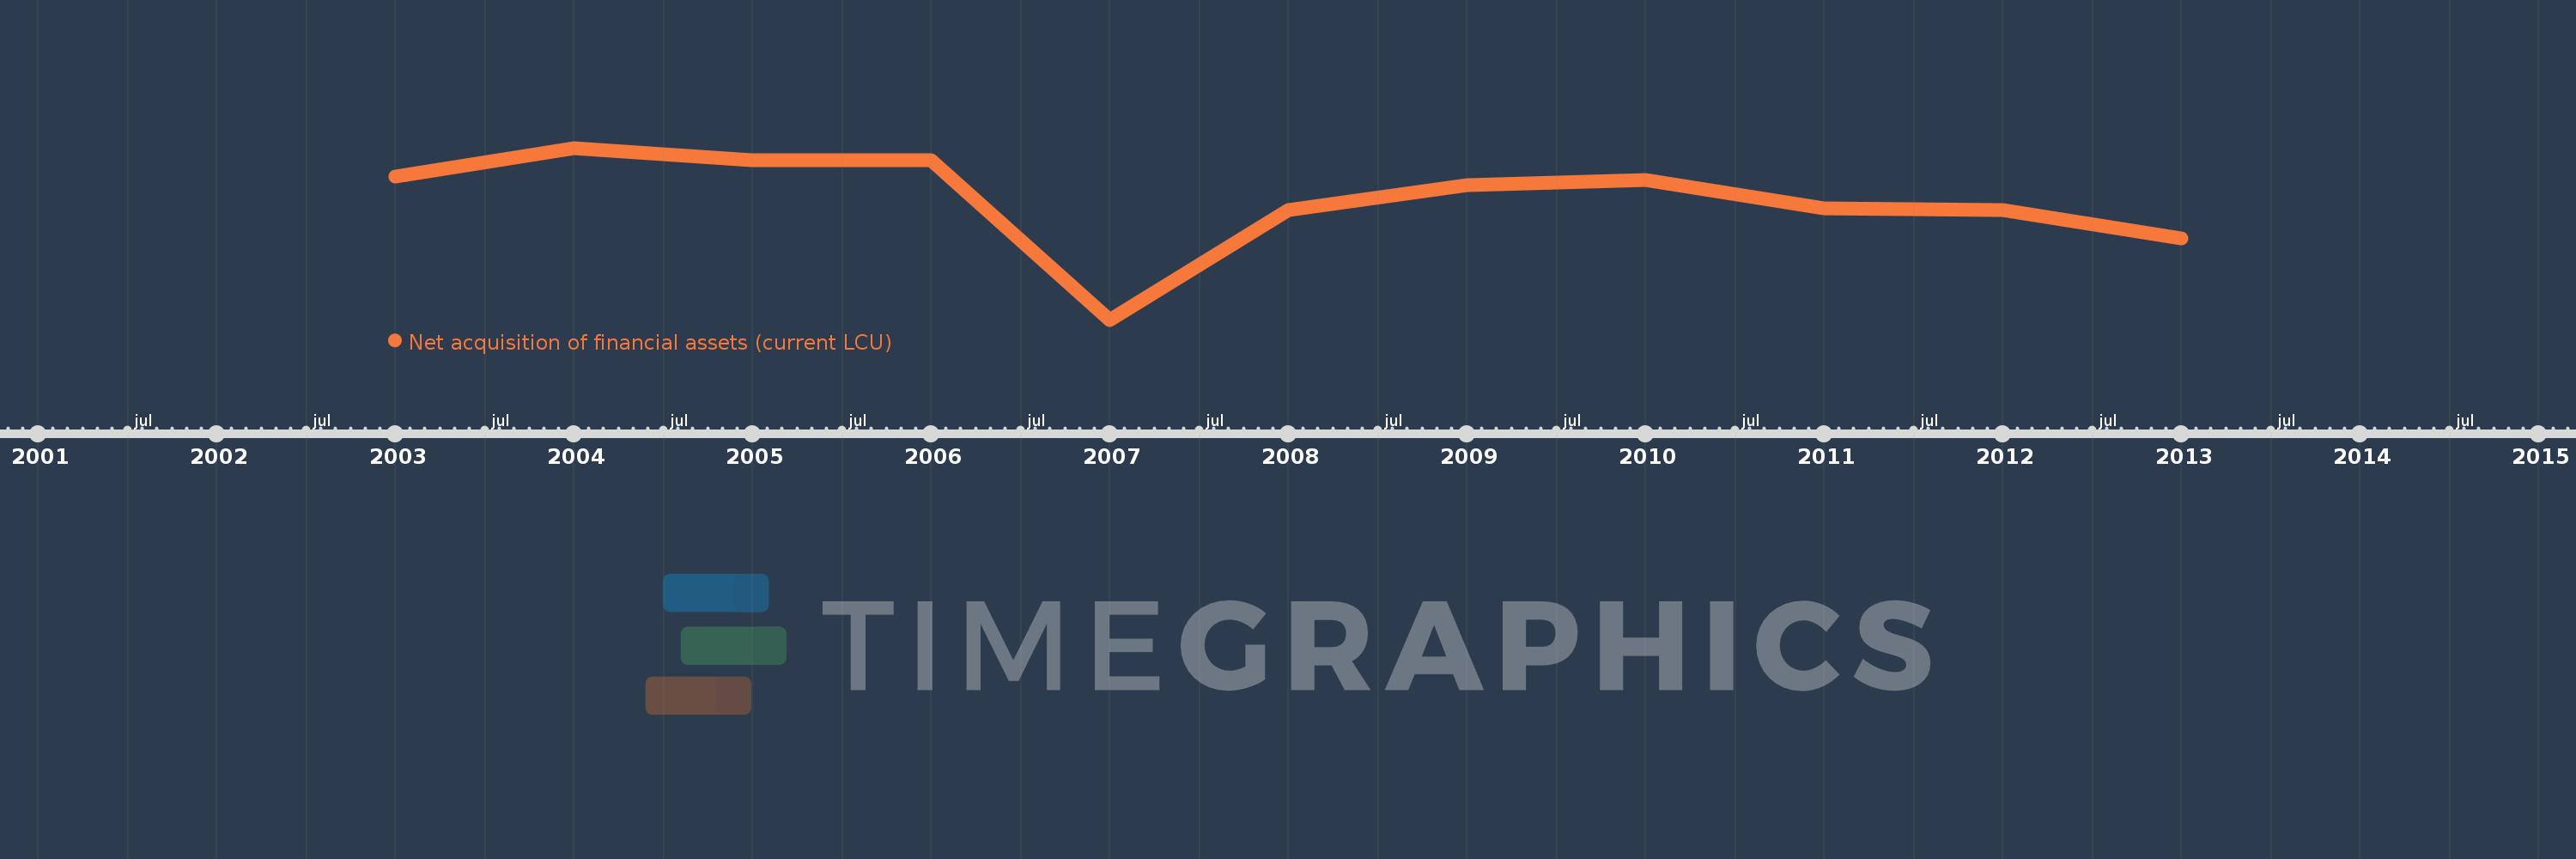
Questa scala temporale mostra un grafico dal 2003 anno al 2013 anno. Egypt, Arab Rep.. I dati fino ad 2002 anno non disponibili. Il numero di osservazioni attuali secondo i date: 11.
La fonte (nome):
Indicatori dello sviluppo mondiale
La fonte (organizzazione):
International Monetary Fund, Government Finance Statistics Yearbook and data files.
Categorie:
Public Sector
sono stati aggiornati
23 apr 2017 anni
Indicatori delle variazioni dei valori per anni
In media:
23.945 Mlrd
Minima:
-27.641 Mlrd
1 gen 2007 anni
Massimo:
46.169 Mlrd
1 gen 2004 anni
Alla data di osservazione
Valore
Variazione assoluta
La variazione rispetto al valore precedente
1 gen 2003 anni
33.946 Mlrd
+33.946 Mlrd
0.0%
1 gen 2004 anni
46.169 Mlrd
+12.223 Mlrd
36.01%
1 gen 2005 anni
40.839 Mlrd
-5.33 Mlrd
-11.54%
1 gen 2006 anni
40.867 Mlrd
+28.0 Mln
0.07%
1 gen 2007 anni
-27.641 Mlrd
-68.508 Mlrd
-167.64%
1 gen 2008 anni
19.573 Mlrd
+47.214 Mlrd
-170.81%
1 gen 2009 anni
30.107 Mlrd
+10.534 Mlrd
53.82%
1 gen 2010 anni
32.488 Mlrd
+2.381 Mlrd
7.91%
1 gen 2011 anni
20.284 Mlrd
-12.204 Mlrd
-37.56%
1 gen 2012 anni
19.363 Mlrd
-921.0 Mln
-4.54%
1 gen 2013 anni
7.395 Mlrd
-11.968 Mlrd
-61.81%
Classificazione dei paesi secondo i statistiche attuali per anni