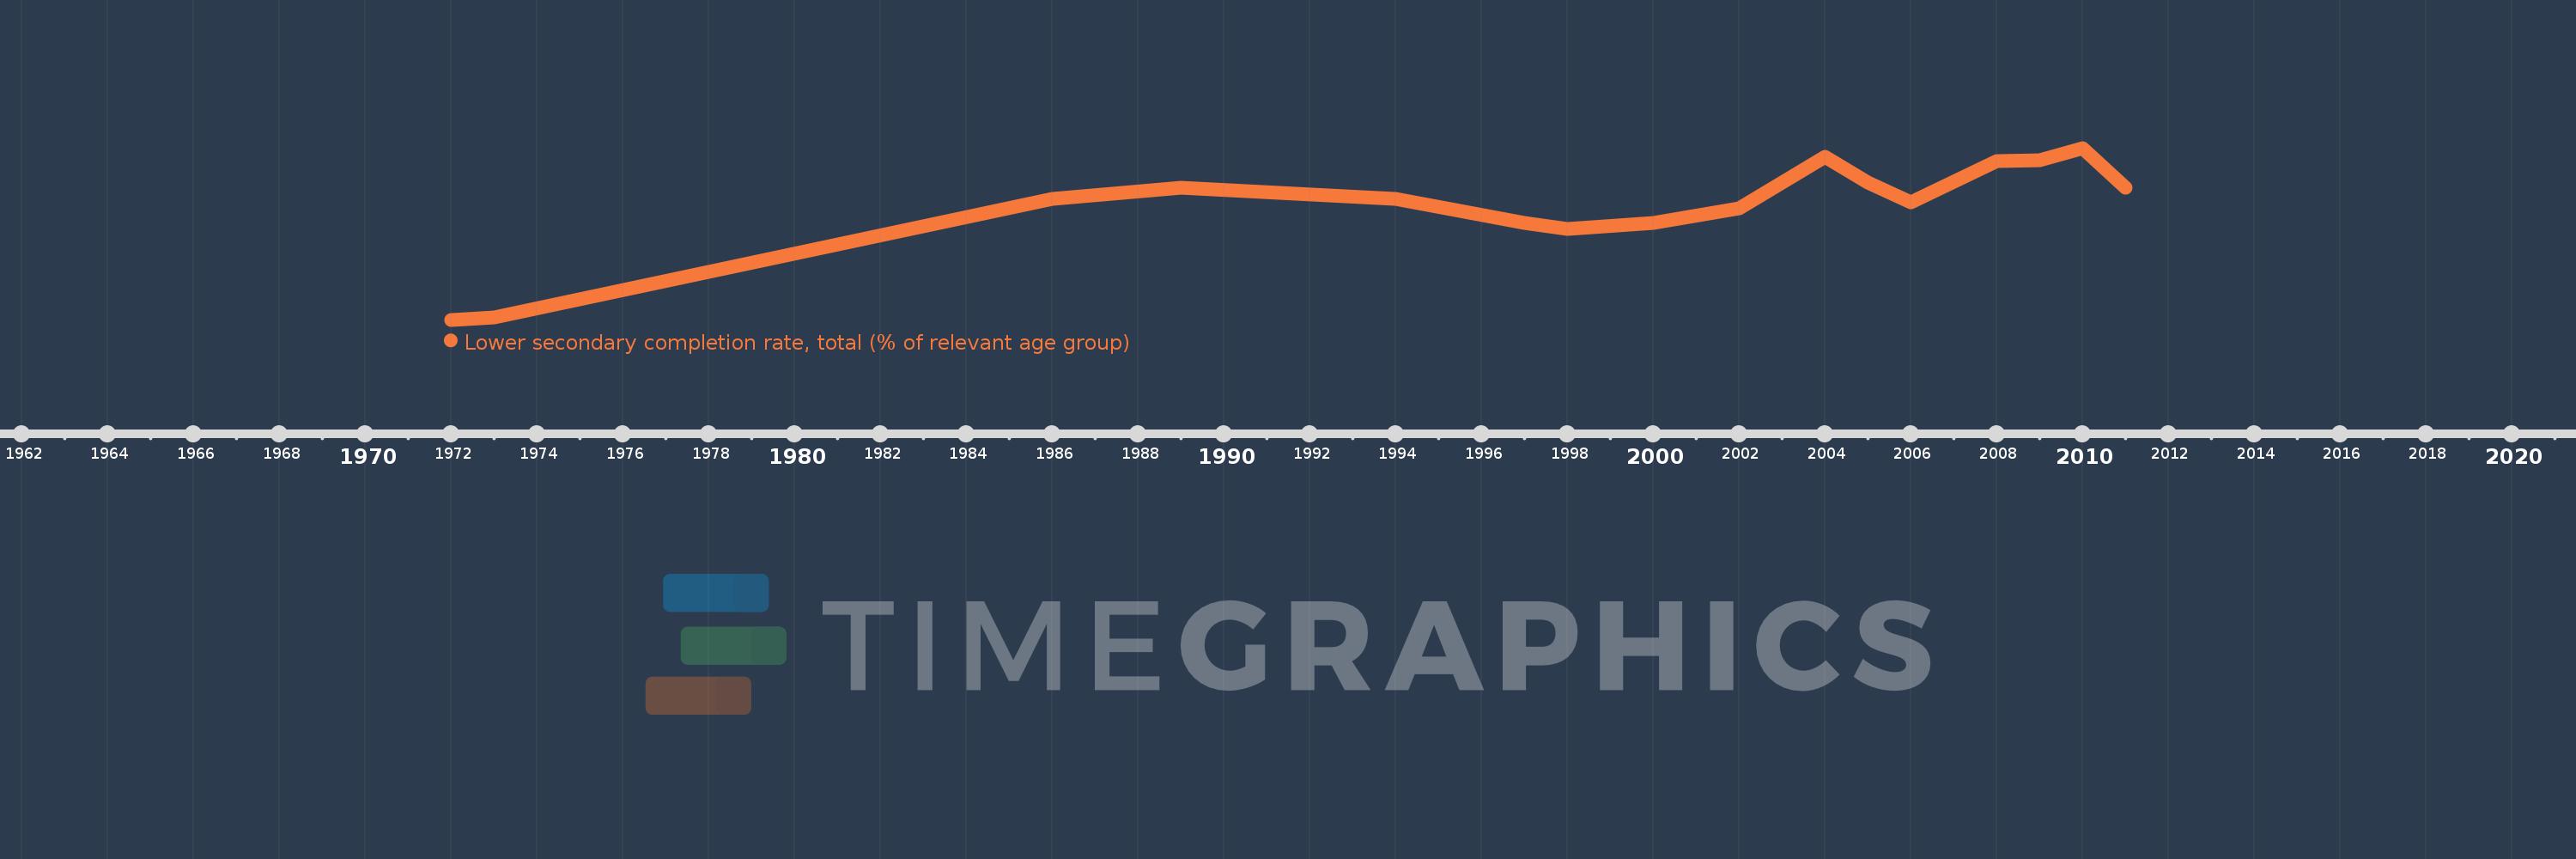
Questa scala temporale mostra un grafico dal 1972 anno al 2011 anno. Trinidad and Tobago. I dati fino ad 1971 anno non disponibili. Il numero di osservazioni attuali secondo i date: 16.
La fonte (nome):
Indicatori dello sviluppo mondiale
La fonte (organizzazione):
United Nations Educational, Scientific, and Cultural Organization (UNESCO) Institute for Statistics.
Categorie:
Education
sono stati aggiornati
23 apr 2017 anni
Indicatori delle variazioni dei valori per anni
In media:
74.724
Minima:
37.33
1 gen 1972 anni
Massimo:
94.09
1 gen 2010 anni
Alla data di osservazione
Valore
Variazione assoluta
La variazione rispetto al valore precedente
1 gen 1972 anni
37.33
+37.33
0.0%
1 gen 1973 anni
38.118
+0.788
2.11%
1 gen 1986 anni
77.271
+39.152
102.71%
1 gen 1989 anni
81.078
+3.807
4.93%
1 gen 1994 anni
77.196
-3.882
-4.79%
1 gen 1997 anni
69.266
-7.93
-10.27%
1 gen 1998 anni
67.338
-1.928
-2.78%
1 gen 2000 anni
69.261
+1.923
2.86%
1 gen 2002 anni
74.266
+5.005
7.23%
1 gen 2004 anni
91.181
+16.915
22.78%
1 gen 2005 anni
82.529
-8.652
-9.49%
1 gen 2006 anni
76.035
-6.494
-7.87%
1 gen 2008 anni
89.606
+13.571
17.85%
1 gen 2009 anni
90.131
+0.526
0.59%
1 gen 2010 anni
94.09
+3.959
4.39%
1 gen 2011 anni
80.894
-13.196
-14.02%
Classificazione dei paesi secondo i statistiche attuali per anni