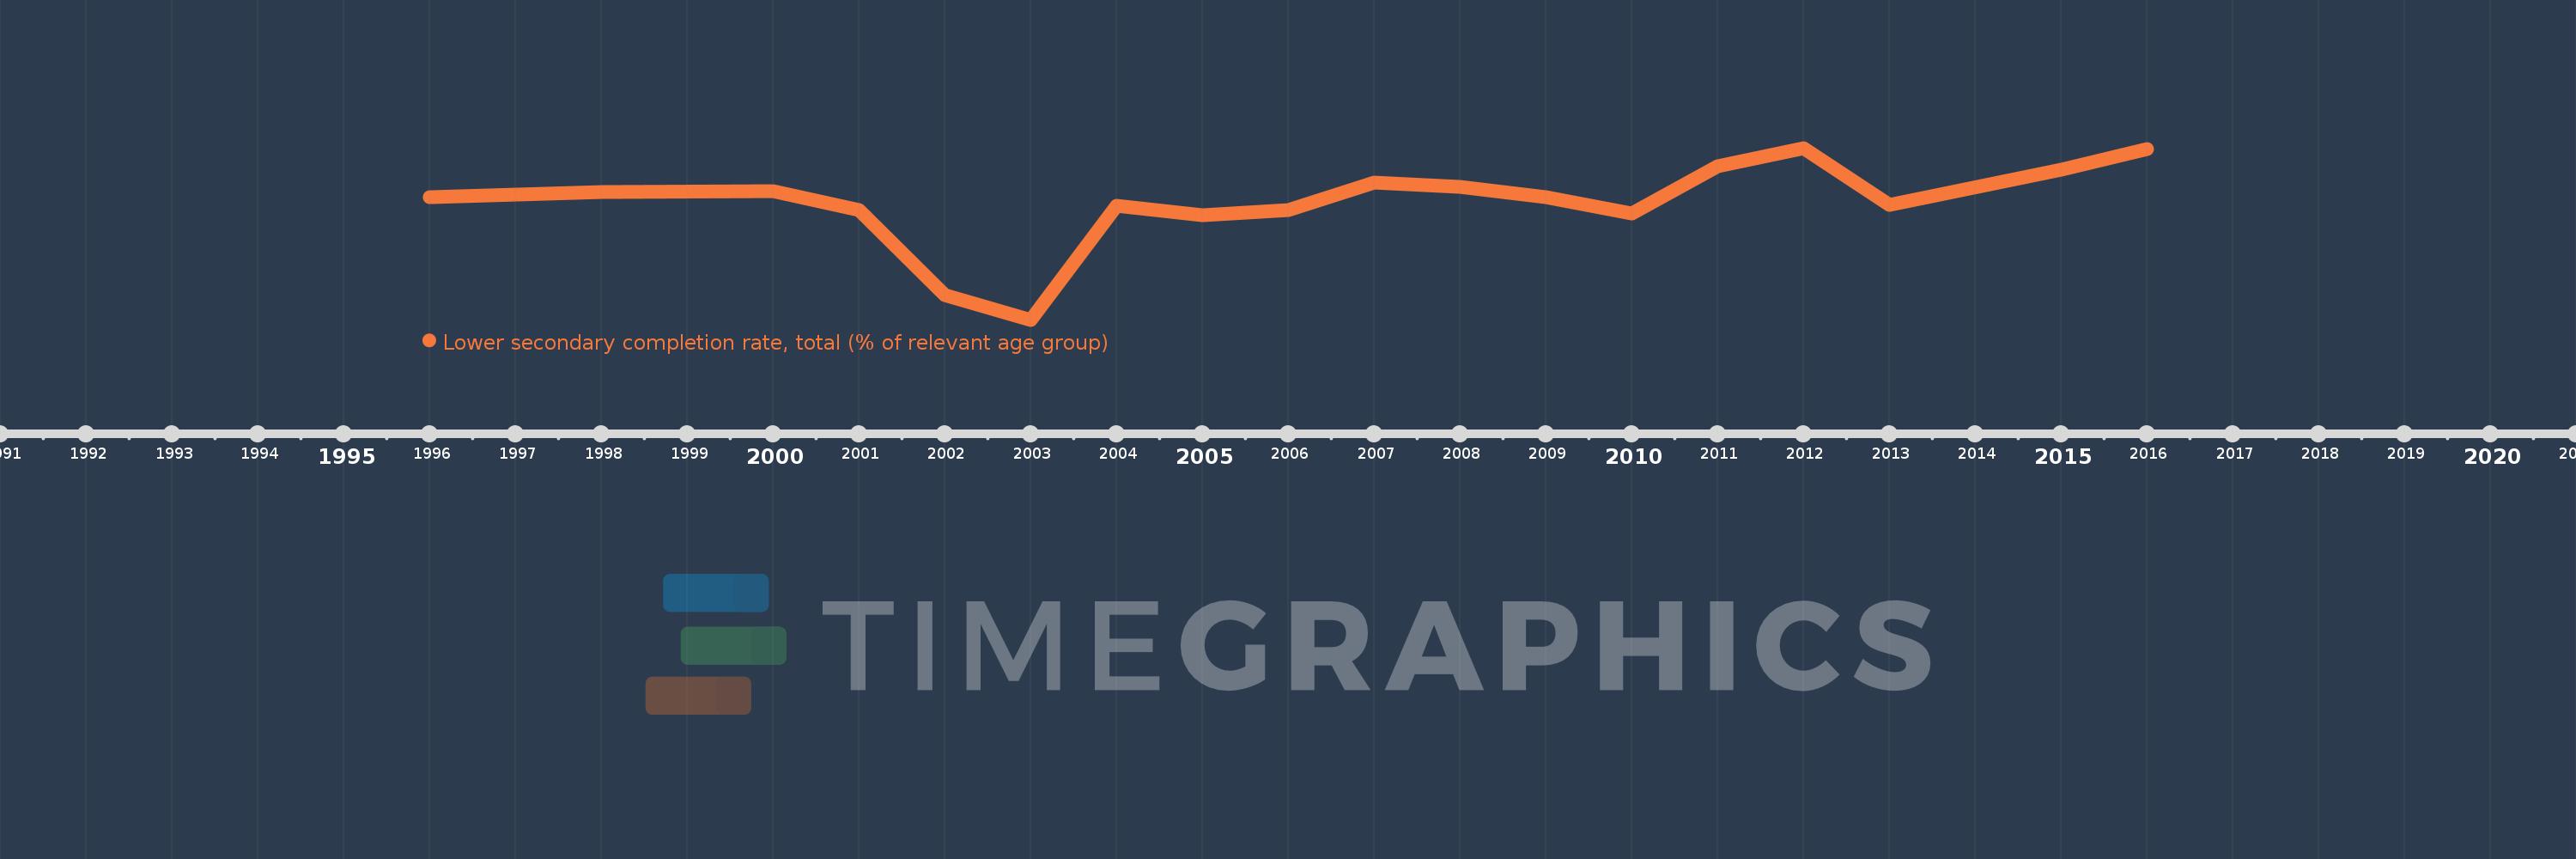
Questa scala temporale mostra un grafico dal 1996 anno al 2016 anno. Tajikistan. I dati fino ad 1995 anno non disponibili. Il numero di osservazioni attuali secondo i date: 18.
La fonte (nome):
Indicatori dello sviluppo mondiale
La fonte (organizzazione):
United Nations Educational, Scientific, and Cultural Organization (UNESCO) Institute for Statistics.
Categorie:
Education
sono stati aggiornati
23 apr 2017 anni
Indicatori delle variazioni dei valori per anni
In media:
86.557
Minima:
65.097
1 gen 2003 anni
Massimo:
96.694
1 gen 2012 anni
Alla data di osservazione
Valore
Variazione assoluta
La variazione rispetto al valore precedente
1 gen 1996 anni
87.591
+87.591
0.0%
1 gen 1998 anni
88.533
+0.942
1.07%
1 gen 2000 anni
88.727
+0.194
0.22%
1 gen 2001 anni
85.303
-3.424
-3.86%
1 gen 2002 anni
69.693
-15.61
-18.3%
1 gen 2003 anni
65.097
-4.596
-6.59%
1 gen 2004 anni
86.081
+20.984
32.24%
1 gen 2005 anni
84.26
-1.822
-2.12%
1 gen 2006 anni
85.206
+0.946
1.12%
1 gen 2007 anni
90.256
+5.05
5.93%
1 gen 2008 anni
89.588
-0.668
-0.74%
1 gen 2009 anni
87.69
-1.898
-2.12%
1 gen 2010 anni
84.655
-3.035
-3.46%
1 gen 2011 anni
93.289
+8.634
10.2%
1 gen 2012 anni
96.694
+3.405
3.65%
1 gen 2013 anni
86.297
-10.397
-10.75%
1 gen 2015 anni
92.633
+6.336
7.34%
1 gen 2016 anni
96.426
+3.794
4.1%
Classificazione dei paesi secondo i statistiche attuali per anni