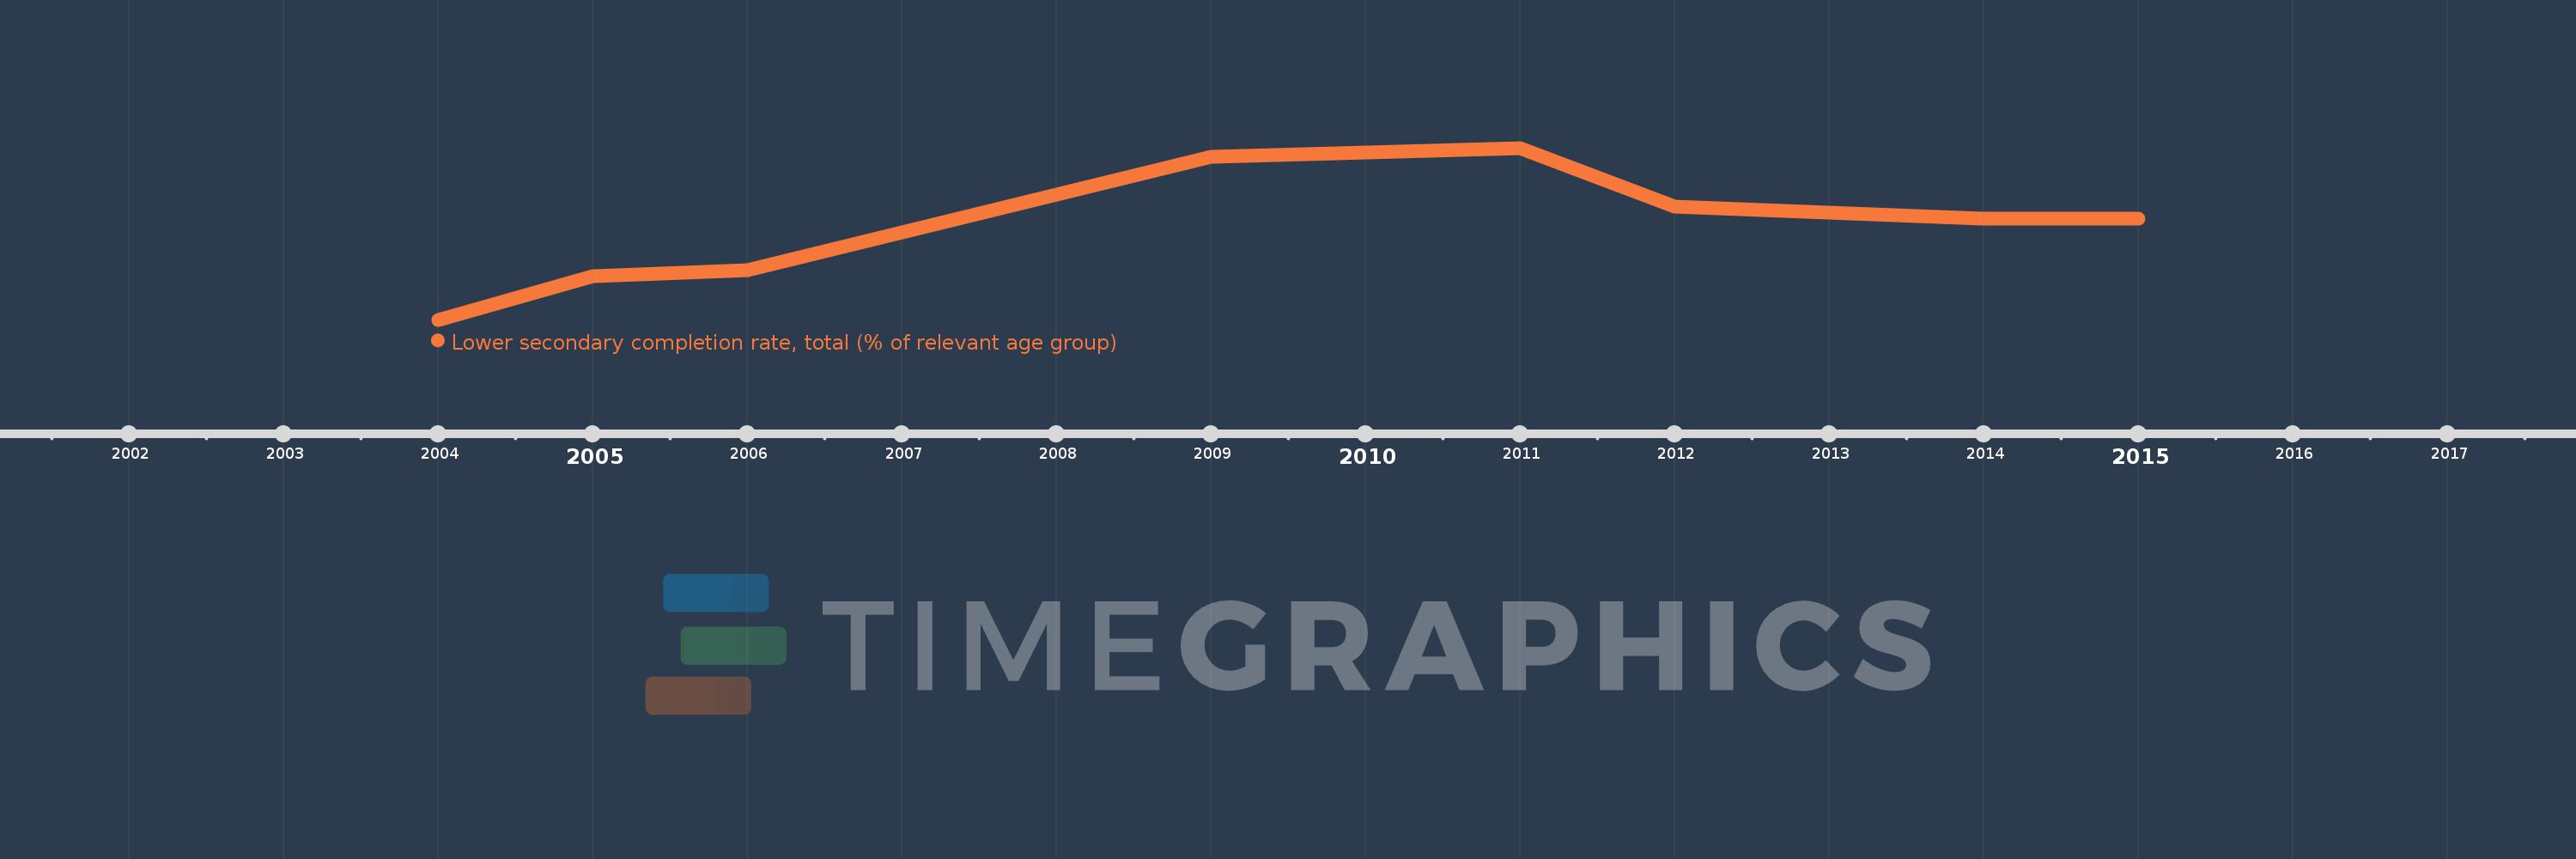
Questa scala temporale mostra un grafico dal 2004 anno al 2015 anno. St. Vincent and the Grenadines. I dati fino ad 2003 anno non disponibili. Il numero di osservazioni attuali secondo i date: 9.
La fonte (nome):
Indicatori dello sviluppo mondiale
La fonte (organizzazione):
United Nations Educational, Scientific, and Cultural Organization (UNESCO) Institute for Statistics.
Categorie:
Education
sono stati aggiornati
23 apr 2017 anni
Indicatori delle variazioni dei valori per anni
In media:
88.773
Minima:
58.876
1 gen 2004 anni
Massimo:
113.299
1 gen 2011 anni
Alla data di osservazione
Valore
Variazione assoluta
La variazione rispetto al valore precedente
1 gen 2004 anni
58.876
+58.876
0.0%
1 gen 2005 anni
72.641
+13.764
23.38%
1 gen 2006 anni
74.566
+1.926
2.65%
1 gen 2009 anni
110.412
+35.846
48.07%
1 gen 2011 anni
113.299
+2.887
2.61%
1 gen 2012 anni
94.747
-18.552
-16.37%
1 gen 2013 anni
92.819
-1.928
-2.03%
1 gen 2014 anni
90.815
-2.004
-2.16%
1 gen 2015 anni
90.785
-0.03
-0.03%
Classificazione dei paesi secondo i statistiche attuali per anni