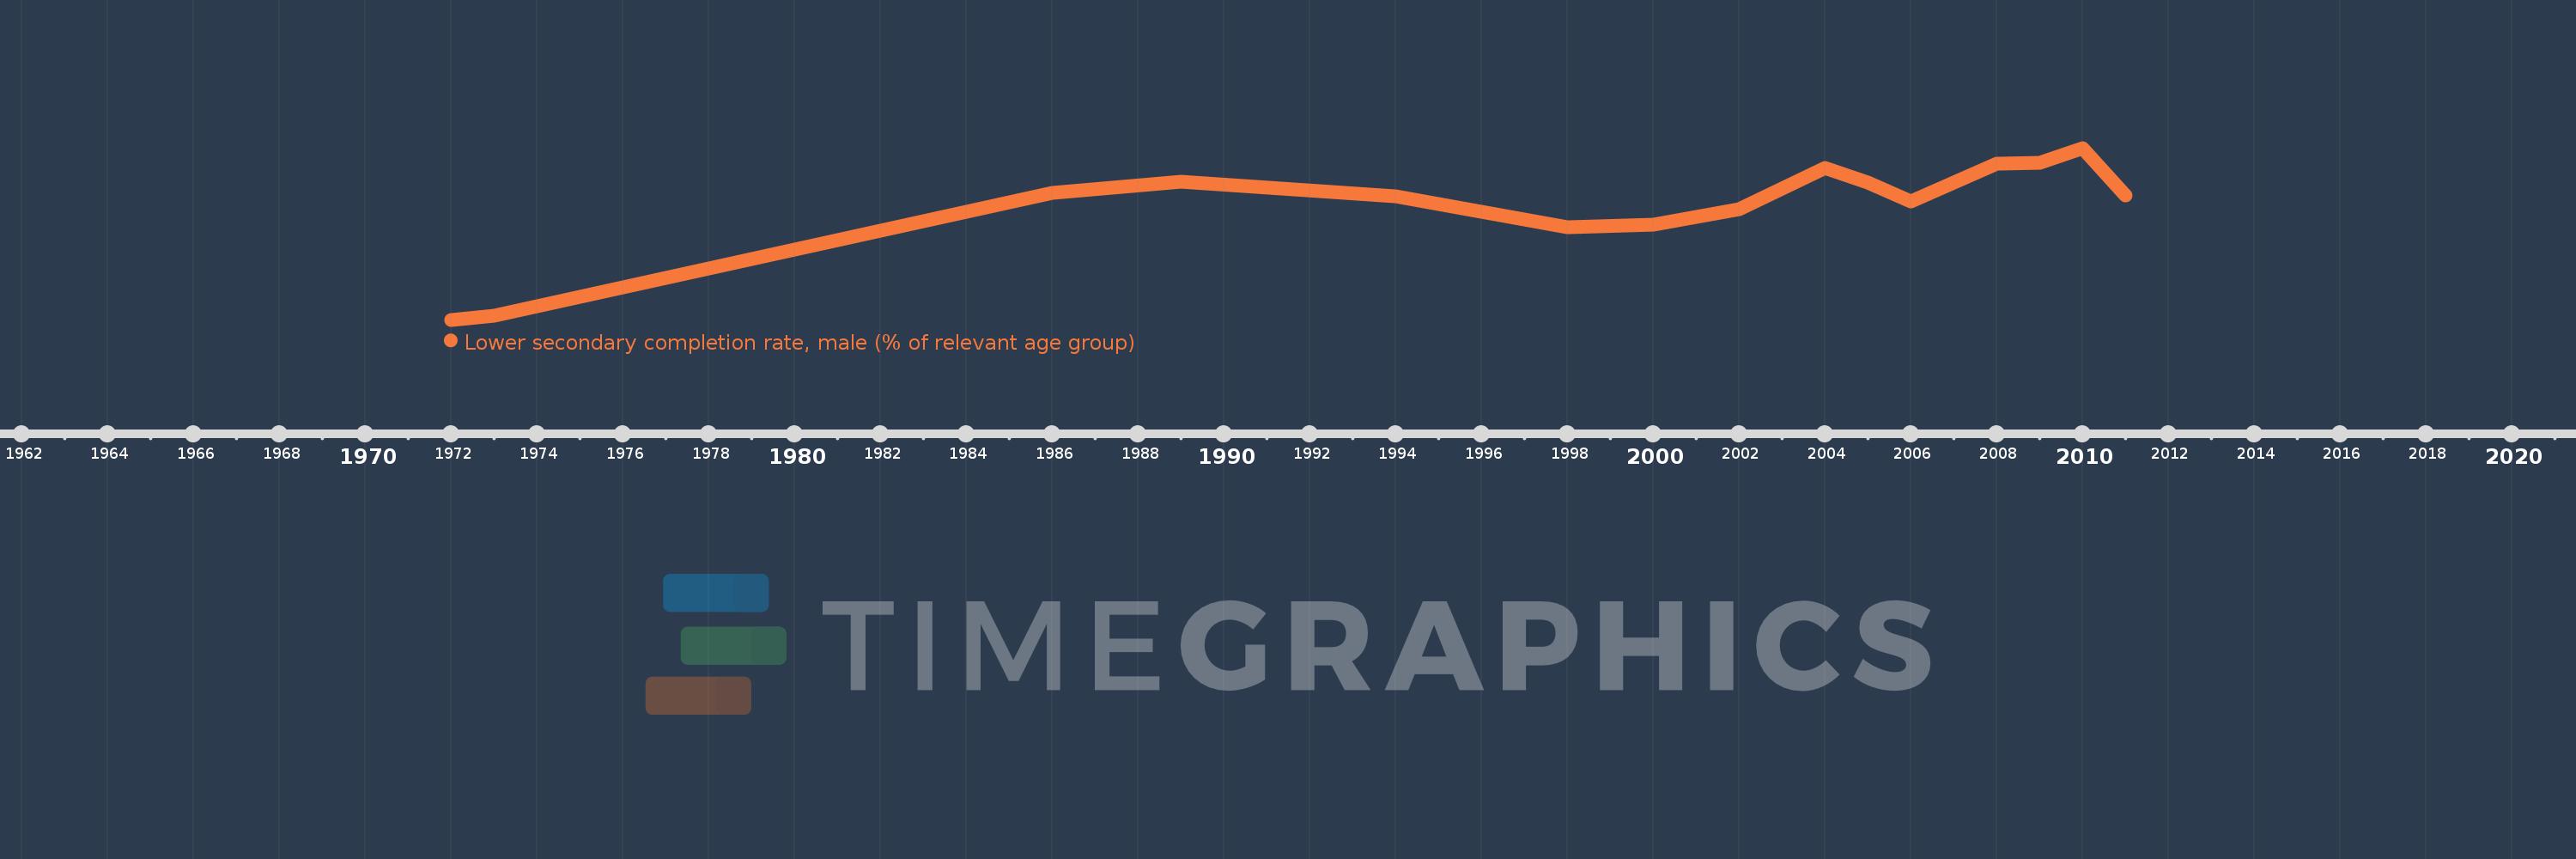
Questa scala temporale mostra un grafico dal 1972 anno al 2011 anno. Trinidad and Tobago. I dati fino ad 1971 anno non disponibili. Il numero di osservazioni attuali secondo i date: 15.
La fonte (nome):
Indicatori dello sviluppo mondiale
La fonte (organizzazione):
United Nations Educational, Scientific, and Cultural Organization (UNESCO) Institute for Statistics.
Categorie:
Education
sono stati aggiornati
23 apr 2017 anni
Indicatori delle variazioni dei valori per anni
In media:
72.588
Minima:
33.923
1 gen 1972 anni
Massimo:
92.324
1 gen 2010 anni
Alla data di osservazione
Valore
Variazione assoluta
La variazione rispetto al valore precedente
1 gen 1972 anni
33.923
+33.923
0.0%
1 gen 1973 anni
35.203
+1.28
3.77%
1 gen 1986 anni
77.12
+41.917
119.07%
1 gen 1989 anni
80.924
+3.804
4.93%
1 gen 1994 anni
75.8
-5.123
-6.33%
1 gen 1998 anni
65.469
-10.331
-13.63%
1 gen 2000 anni
66.203
+0.734
1.12%
1 gen 2002 anni
71.421
+5.219
7.88%
1 gen 2004 anni
85.401
+13.98
19.57%
1 gen 2005 anni
80.652
-4.749
-5.56%
1 gen 2006 anni
74.065
-6.587
-8.17%
1 gen 2008 anni
86.874
+12.809
17.29%
1 gen 2009 anni
87.169
+0.296
0.34%
1 gen 2010 anni
92.324
+5.155
5.91%
1 gen 2011 anni
76.27
-16.054
-17.39%
Classificazione dei paesi secondo i statistiche attuali per anni