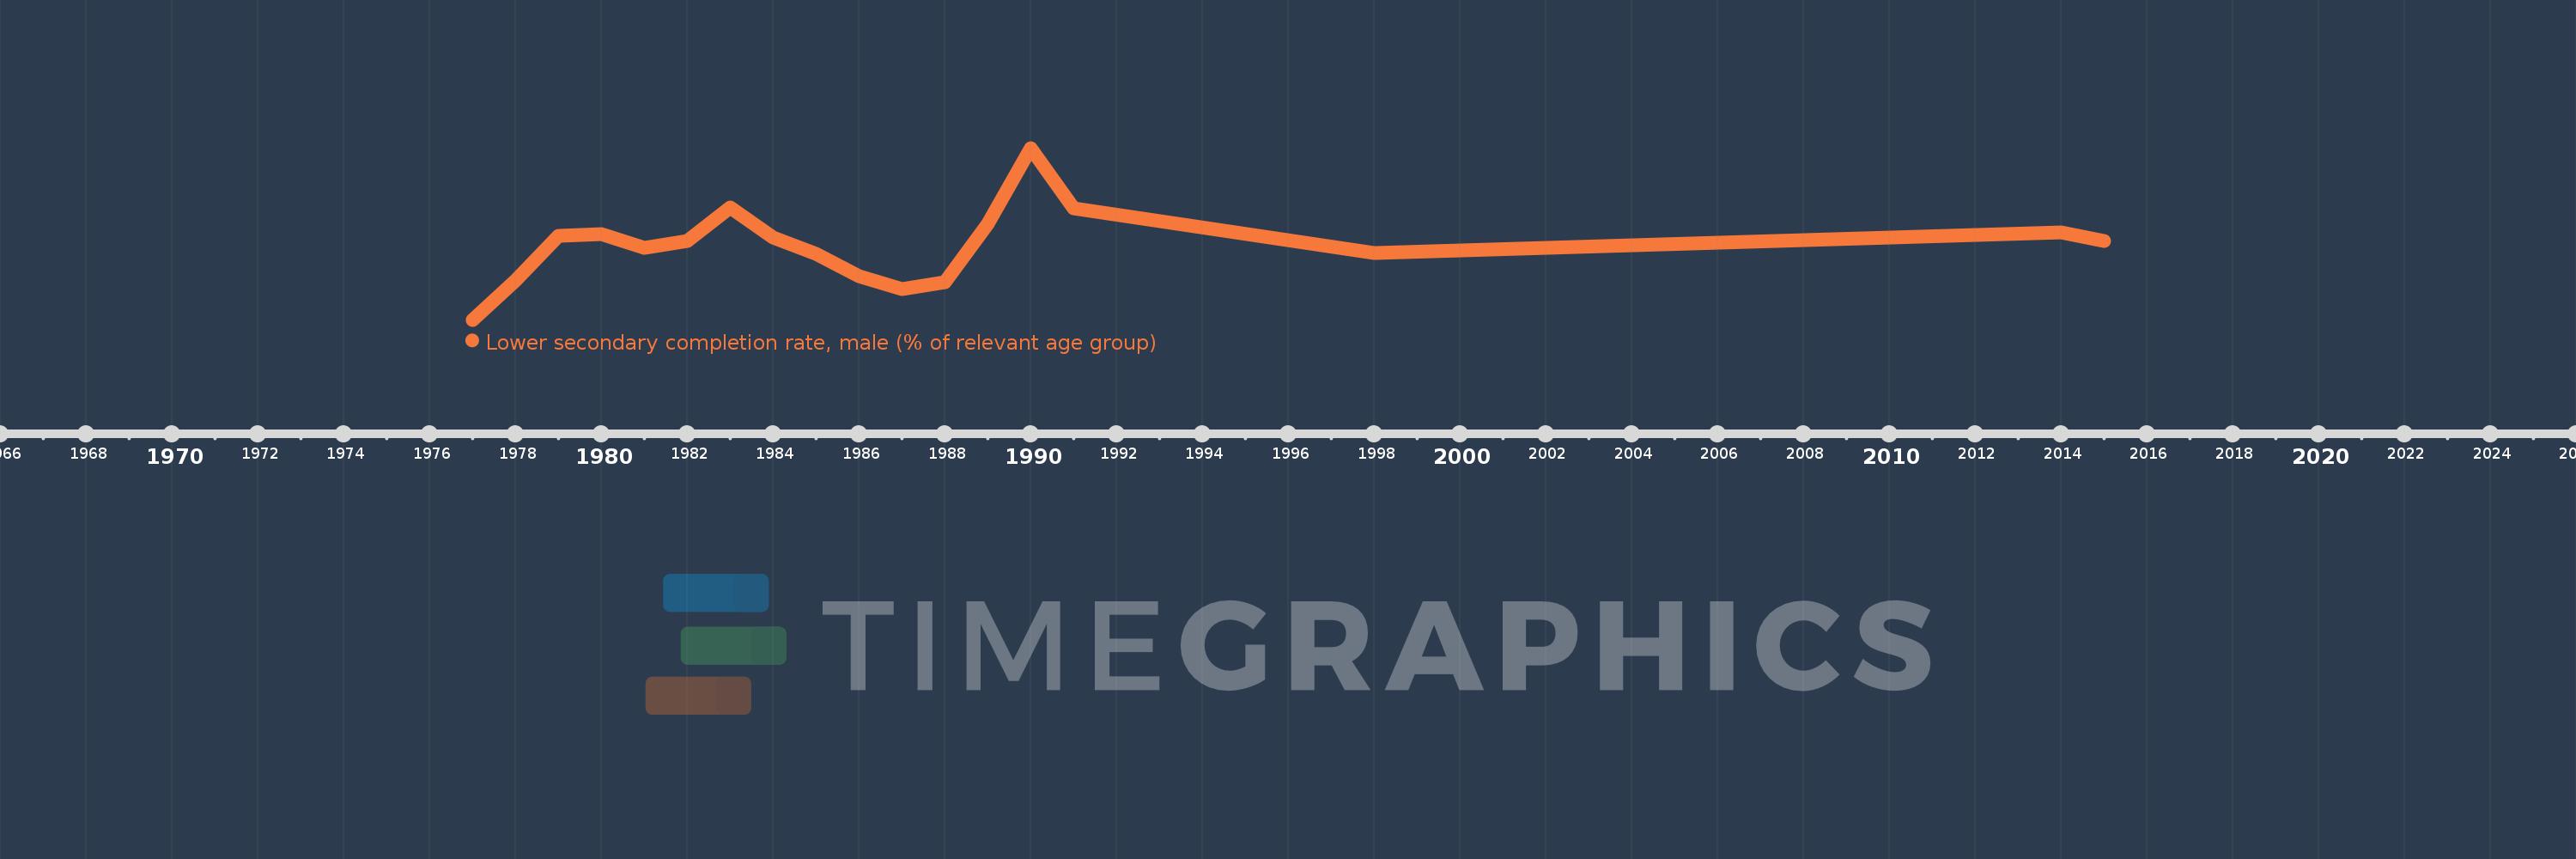
Questa scala temporale mostra un grafico dal 1977 anno al 2015 anno. Hungary. I dati fino ad 1976 anno non disponibili. Il numero di osservazioni attuali secondo i date: 18.
La fonte (nome):
Indicatori dello sviluppo mondiale
La fonte (organizzazione):
United Nations Educational, Scientific, and Cultural Organization (UNESCO) Institute for Statistics.
Categorie:
Education
sono stati aggiornati
23 apr 2017 anni
Indicatori delle variazioni dei valori per anni
In media:
93.201
Minima:
83.57
1 gen 1977 anni
Massimo:
105.718
1 gen 1990 anni
Alla data di osservazione
Valore
Variazione assoluta
La variazione rispetto al valore precedente
1 gen 1977 anni
83.57
+83.57
0.0%
1 gen 1978 anni
88.611
+5.041
6.03%
1 gen 1979 anni
94.438
+5.827
6.58%
1 gen 1980 anni
94.641
+0.203
0.21%
1 gen 1981 anni
92.834
-1.807
-1.91%
1 gen 1982 anni
93.729
+0.895
0.96%
1 gen 1983 anni
98.069
+4.339
4.63%
1 gen 1984 anni
94.201
-3.868
-3.94%
1 gen 1985 anni
92.023
-2.178
-2.31%
1 gen 1986 anni
89.218
-2.805
-3.05%
1 gen 1987 anni
87.524
-1.694
-1.9%
1 gen 1988 anni
88.412
+0.888
1.01%
1 gen 1989 anni
95.976
+7.564
8.56%
1 gen 1990 anni
105.718
+9.742
10.15%
1 gen 1991 anni
97.945
-7.773
-7.35%
1 gen 1998 anni
92.181
-5.764
-5.88%
1 gen 2014 anni
94.846
+2.665
2.89%
1 gen 2015 anni
93.682
-1.164
-1.23%
Classificazione dei paesi secondo i statistiche attuali per anni