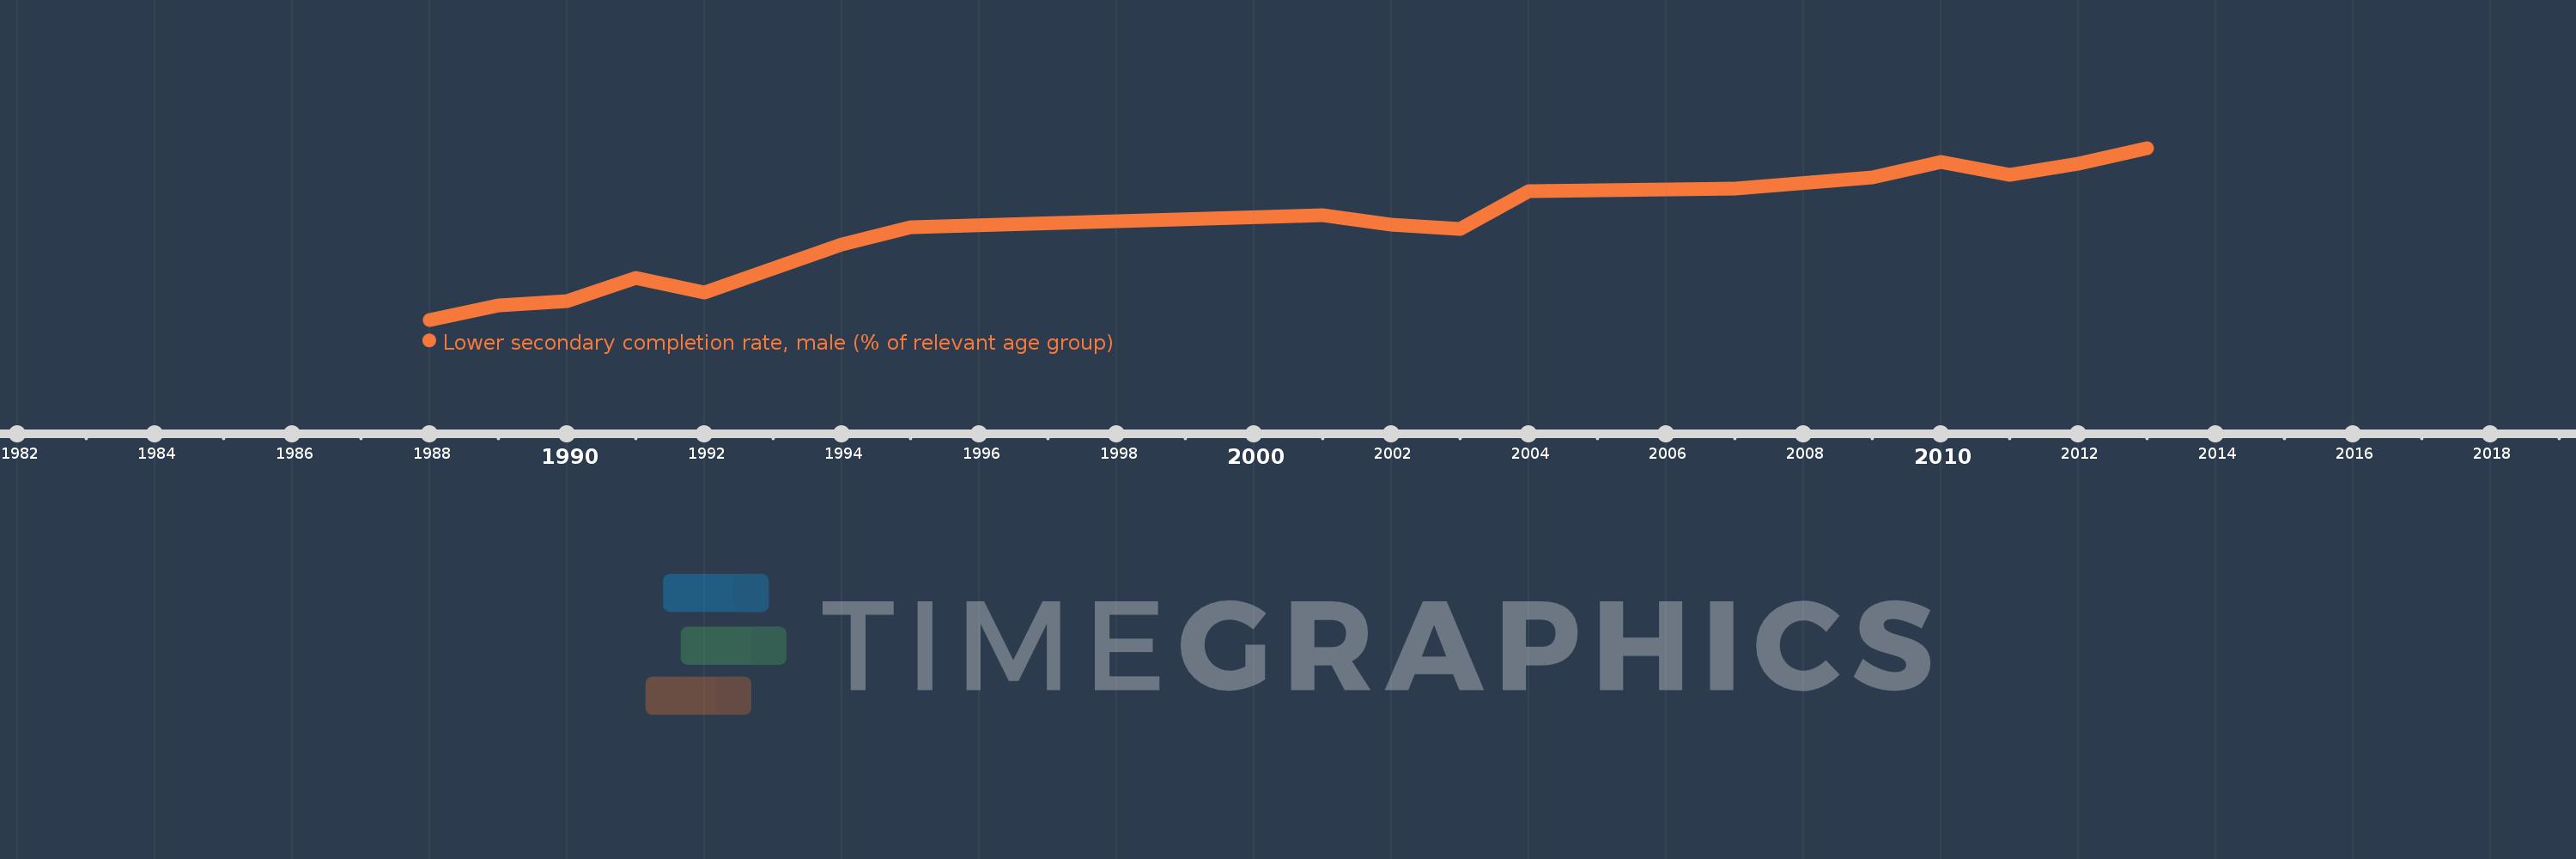
Questa scala temporale mostra un grafico dal 1988 anno al 2013 anno. Iran, Islamic Rep.. I dati fino ad 1987 anno non disponibili. Il numero di osservazioni attuali secondo i date: 17.
La fonte (nome):
Indicatori dello sviluppo mondiale
La fonte (organizzazione):
United Nations Educational, Scientific, and Cultural Organization (UNESCO) Institute for Statistics.
Categorie:
Education
sono stati aggiornati
23 apr 2017 anni
Indicatori delle variazioni dei valori per anni
In media:
75.75
Minima:
51.941
1 gen 1988 anni
Massimo:
95.588
1 gen 2013 anni
Alla data di osservazione
Valore
Variazione assoluta
La variazione rispetto al valore precedente
1 gen 1988 anni
51.941
+51.941
0.0%
1 gen 1989 anni
55.505
+3.564
6.86%
1 gen 1990 anni
56.58
+1.075
1.94%
1 gen 1991 anni
62.492
+5.912
10.45%
1 gen 1992 anni
58.951
-3.541
-5.67%
1 gen 1994 anni
71.162
+12.211
20.71%
1 gen 1995 anni
75.47
+4.308
6.05%
1 gen 2001 anni
78.417
+2.947
3.9%
1 gen 2002 anni
76.181
-2.236
-2.85%
1 gen 2003 anni
75.11
-1.071
-1.41%
1 gen 2004 anni
84.617
+9.507
12.66%
1 gen 2007 anni
85.168
+0.551
0.65%
1 gen 2009 anni
88.061
+2.893
3.4%
1 gen 2010 anni
91.983
+3.922
4.45%
1 gen 2011 anni
88.851
-3.131
-3.4%
1 gen 2012 anni
91.679
+2.828
3.18%
1 gen 2013 anni
95.588
+3.909
4.26%
Classificazione dei paesi secondo i statistiche attuali per anni