33
/it/
AIzaSyAYiBZKx7MnpbEhh9jyipgxe19OcubqV5w
August 1, 2025
260889
Tanzania
TZA
true
2
1
GDP (constant LCU)
2016,2015,2014,2013,2012,2011,2010,2009,2008,2007,2006,2005,2004,2003,2002,2001,2000,1999,1998,1997,1996,1995,1994,1993,1992,1991,1990,1989
Download
Biblioteca di statistiche globali →Tanzania →

GDP (constant LCU)

Queste statistiche in altri paesi:

AfghanistanAlbaniaAlgeriaAndorraAngolaAntigua and BarbudaArgentinaArmeniaArubaAustraliaAustriaAzerbaijanBahamas, TheBahrainBangladeshBarbadosBelarusBelgiumBelizeBeninBermudaBhutanBoliviaBosnia and HerzegovinaBotswanaBrazilBrunei DarussalamBulgariaBurkina FasoBurundiCabo VerdeCambodiaCameroonCanadaCayman IslandsCentral African RepublicChadChannel IslandsChileChinaColombiaComorosCongo, Dem. Rep.Congo, Rep.Costa RicaCote d'IvoireCroatiaCubaCyprusCzech RepublicDenmarkDjiboutiDominicaDominican RepublicEcuadorEgypt, Arab Rep.El SalvadorEquatorial GuineaEritreaEstoniaEthiopiaFijiFinlandFranceFrench PolynesiaGabonGambia, TheGeorgiaGermanyGhanaGreeceGreenlandGrenadaGuatemalaGuineaGuinea-BissauGuyanaHaitiHondurasHong Kong SAR, ChinaHungaryIcelandIndiaIndonesiaIran, Islamic Rep.IraqIrelandIsle of ManIsraelItalyJamaicaJapanJordanKazakhstanKenyaKiribatiKorea, Rep.KosovoKuwaitKyrgyz RepublicLao PDRLatviaLebanonLesothoLiberiaLibyaLiechtensteinLithuaniaLuxembourgMacao SAR, ChinaMacedonia, FYRMadagascarMalawiMalaysiaMaldivesMaliMaltaMarshall IslandsMauritaniaMauritiusMexicoMicronesia, Fed. Sts.MoldovaMonacoMongoliaMontenegroMoroccoMozambiqueMyanmarNamibiaNauruNepalNetherlandsNew CaledoniaNew ZealandNicaraguaNigerNigeriaNorwayOmanPakistanPalauPanamaPapua New GuineaParaguayPeruPhilippinesPolandPortugalPuerto RicoQatarRomaniaRussian FederationRwandaSamoaSan MarinoSao Tome and PrincipeSaudi ArabiaSenegalSerbiaSeychellesSierra LeoneSingaporeSlovak RepublicSloveniaSolomon IslandsSomaliaSouth AfricaSouth SudanSpainSri LankaSt. Kitts and NevisSt. LuciaSt. Vincent and the GrenadinesSudanSurinameSwazilandSwedenSwitzerlandSyrian Arab RepublicTajikistanTanzaniaThailandTimor-LesteTogoTongaTrinidad and TobagoTunisiaTurkeyTurkmenistanTuvaluUgandaUkraineUnited Arab EmiratesUnited KingdomUnited StatesUruguayUzbekistanVanuatuVenezuela, RBVietnamVirgin Islands (U.S.)West Bank and GazaYemen, Rep.ZambiaZimbabwe

Linea del tempo:

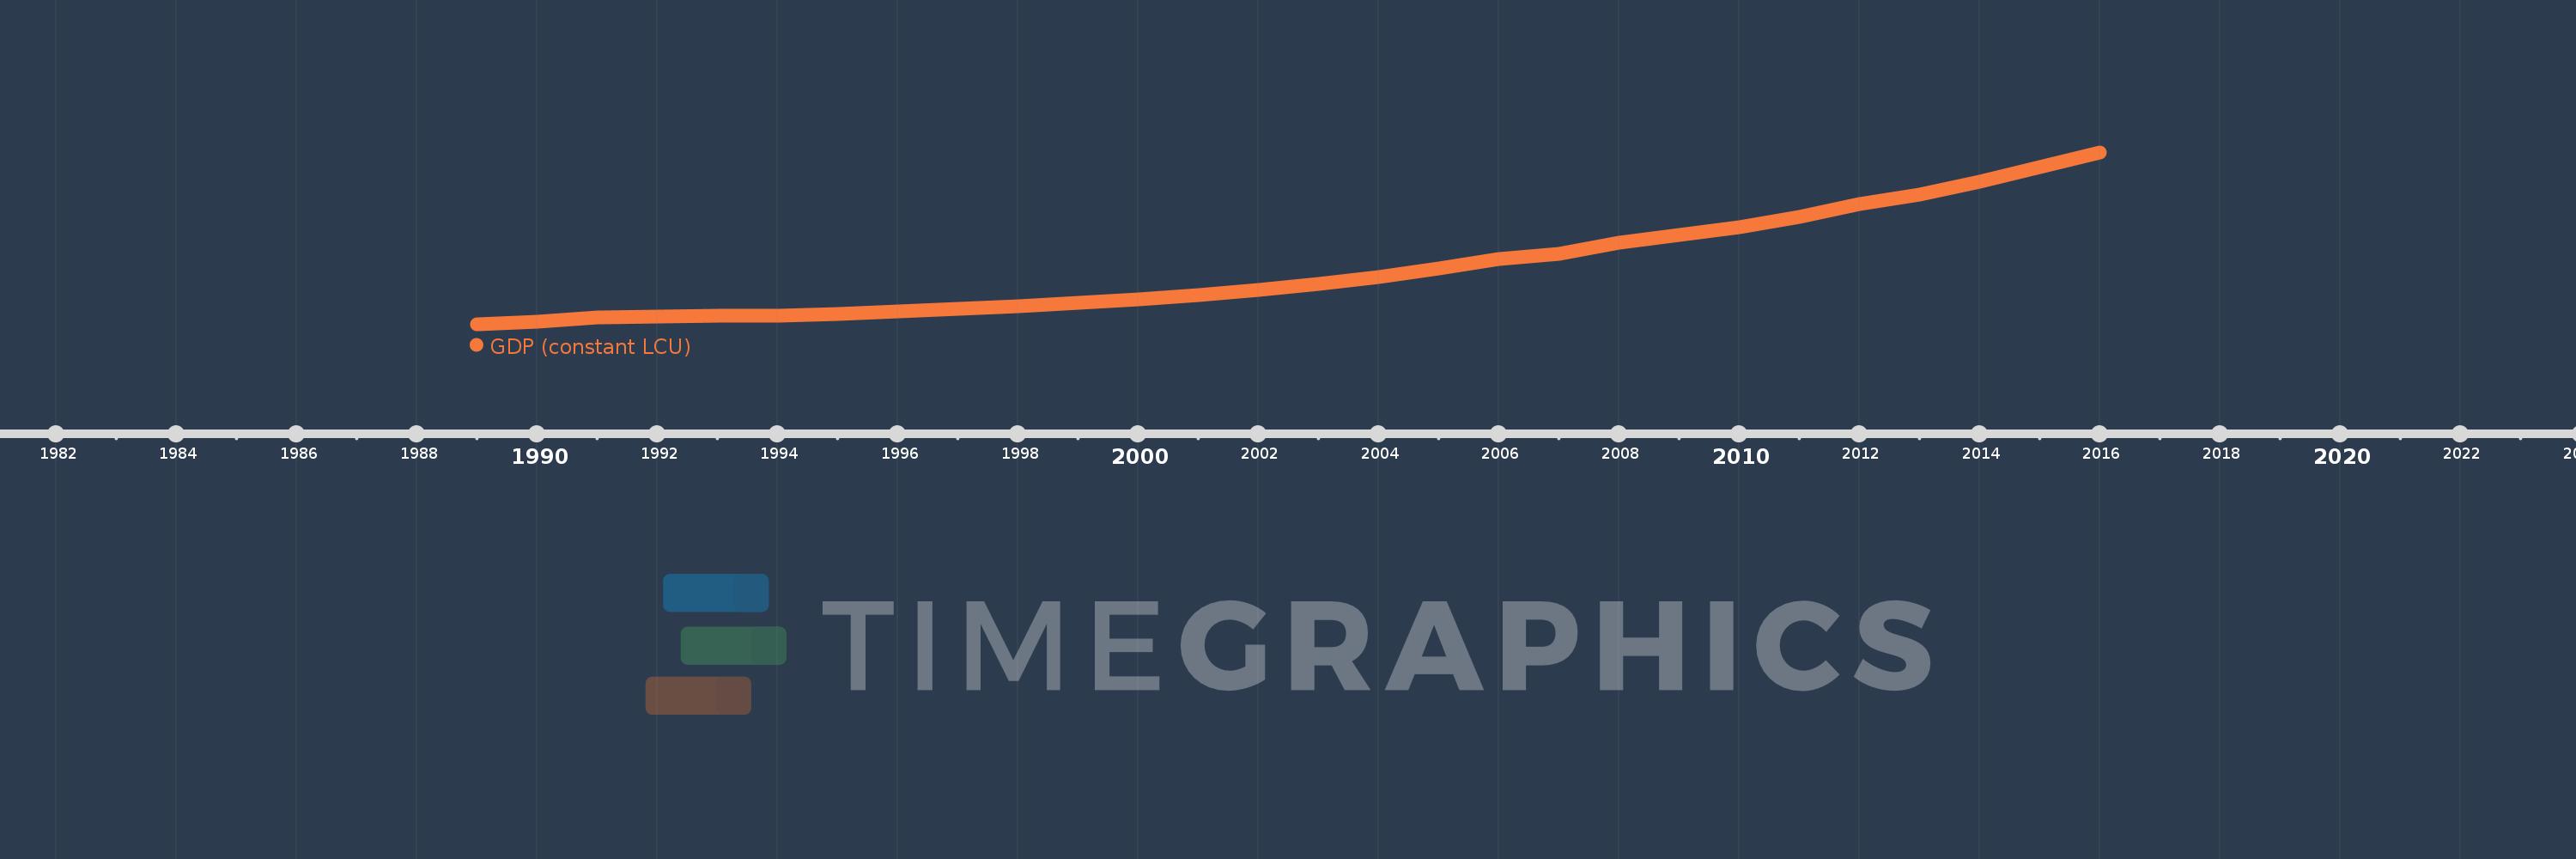
Questa scala temporale mostra un grafico dal 1989 anno al 2016 anno. Tanzania. I dati fino ad 1988 anno non disponibili. Il numero di osservazioni attuali secondo i date: 28.

La fonte (nome):

Indicatori dello sviluppo mondiale

La fonte (organizzazione):

World Bank national accounts data, and OECD National Accounts data files.

Categorie:

Economy & Growth

sono stati aggiornati

23 apr 2017 anni

Indicatori delle variazioni dei valori per anni

In media:
21.901 Trln
Minima:
11.107 Trln
1 gen 1989 anni
Massimo:
44.101 Trln
1 gen 2016 anni
Alla data di osservazione
Valore
Variazione assoluta
La variazione rispetto al valore precedente
1 gen 1989 anni
11.107 Trln
+11.107 Trln
0.0%
1 gen 1990 anni
11.526 Trln
+418.133 Mlrd
3.76%
1 gen 1991 anni
12.338 Trln
+811.985 Mlrd
7.05%
1 gen 1992 anni
12.593 Trln
+255.633 Mlrd
2.07%
1 gen 1993 anni
12.667 Trln
+73.585 Mlrd
0.58%
1 gen 1994 anni
12.82 Trln
+152.736 Mlrd
1.21%
1 gen 1995 anni
13.02 Trln
+200.967 Mlrd
1.57%
1 gen 1996 anni
13.485 Trln
+464.82 Mlrd
3.57%
1 gen 1997 anni
14.098 Trln
+612.822 Mlrd
4.54%
1 gen 1998 anni
14.595 Trln
+496.998 Mlrd
3.53%
1 gen 1999 anni
15.136 Trln
+541.262 Mlrd
3.71%
1 gen 2000 anni
15.869 Trln
+732.659 Mlrd
4.84%
1 gen 2001 anni
16.652 Trln
+782.954 Mlrd
4.93%
1 gen 2002 anni
17.651 Trln
+998.758 Mlrd
6.0%
1 gen 2003 anni
18.915 Trln
+1.264 Trln
7.16%
1 gen 2004 anni
20.218 Trln
+1.303 Trln
6.89%
1 gen 2005 anni
21.8 Trln
+1.583 Trln
7.83%
1 gen 2006 anni
23.582 Trln
+1.782 Trln
8.17%
1 gen 2007 anni
24.681 Trln
+1.099 Trln
4.66%
1 gen 2008 anni
26.77 Trln
+2.089 Trln
8.46%
1 gen 2009 anni
28.261 Trln
+1.49 Trln
5.57%
1 gen 2010 anni
29.782 Trln
+1.521 Trln
5.38%
1 gen 2011 anni
31.676 Trln
+1.894 Trln
6.36%
1 gen 2012 anni
34.179 Trln
+2.504 Trln
7.9%
1 gen 2013 anni
35.936 Trln
+1.757 Trln
5.14%
1 gen 2014 anni
38.547 Trln
+2.61 Trln
7.26%
1 gen 2015 anni
41.231 Trln
+2.685 Trln
6.97%
1 gen 2016 anni
44.101 Trln
+2.869 Trln
6.96%

Classificazione dei paesi secondo i statistiche attuali per anni