33
/it/
AIzaSyAYiBZKx7MnpbEhh9jyipgxe19OcubqV5w
August 1, 2025
176382
Lebanon
LBN
true
2
1
GDP (constant LCU)
2016,2015,2014,2013,2012,2011,2010,2009,2008,2007,2006,2005,2004,2003,2002,2001,2000,1999,1998,1997,1996,1995,1994,1993,1992,1991,1990,1989
Download
Biblioteca di statistiche globali →Lebanon →

GDP (constant LCU)

Queste statistiche in altri paesi:

AfghanistanAlbaniaAlgeriaAndorraAngolaAntigua and BarbudaArgentinaArmeniaArubaAustraliaAustriaAzerbaijanBahamas, TheBahrainBangladeshBarbadosBelarusBelgiumBelizeBeninBermudaBhutanBoliviaBosnia and HerzegovinaBotswanaBrazilBrunei DarussalamBulgariaBurkina FasoBurundiCabo VerdeCambodiaCameroonCanadaCayman IslandsCentral African RepublicChadChannel IslandsChileChinaColombiaComorosCongo, Dem. Rep.Congo, Rep.Costa RicaCote d'IvoireCroatiaCubaCyprusCzech RepublicDenmarkDjiboutiDominicaDominican RepublicEcuadorEgypt, Arab Rep.El SalvadorEquatorial GuineaEritreaEstoniaEthiopiaFijiFinlandFranceFrench PolynesiaGabonGambia, TheGeorgiaGermanyGhanaGreeceGreenlandGrenadaGuatemalaGuineaGuinea-BissauGuyanaHaitiHondurasHong Kong SAR, ChinaHungaryIcelandIndiaIndonesiaIran, Islamic Rep.IraqIrelandIsle of ManIsraelItalyJamaicaJapanJordanKazakhstanKenyaKiribatiKorea, Rep.KosovoKuwaitKyrgyz RepublicLao PDRLatviaLebanonLesothoLiberiaLibyaLiechtensteinLithuaniaLuxembourgMacao SAR, ChinaMacedonia, FYRMadagascarMalawiMalaysiaMaldivesMaliMaltaMarshall IslandsMauritaniaMauritiusMexicoMicronesia, Fed. Sts.MoldovaMonacoMongoliaMontenegroMoroccoMozambiqueMyanmarNamibiaNauruNepalNetherlandsNew CaledoniaNew ZealandNicaraguaNigerNigeriaNorwayOmanPakistanPalauPanamaPapua New GuineaParaguayPeruPhilippinesPolandPortugalPuerto RicoQatarRomaniaRussian FederationRwandaSamoaSan MarinoSao Tome and PrincipeSaudi ArabiaSenegalSerbiaSeychellesSierra LeoneSingaporeSlovak RepublicSloveniaSolomon IslandsSomaliaSouth AfricaSouth SudanSpainSri LankaSt. Kitts and NevisSt. LuciaSt. Vincent and the GrenadinesSudanSurinameSwazilandSwedenSwitzerlandSyrian Arab RepublicTajikistanTanzaniaThailandTimor-LesteTogoTongaTrinidad and TobagoTunisiaTurkeyTurkmenistanTuvaluUgandaUkraineUnited Arab EmiratesUnited KingdomUnited StatesUruguayUzbekistanVanuatuVenezuela, RBVietnamVirgin Islands (U.S.)West Bank and GazaYemen, Rep.ZambiaZimbabwe

Linea del tempo:

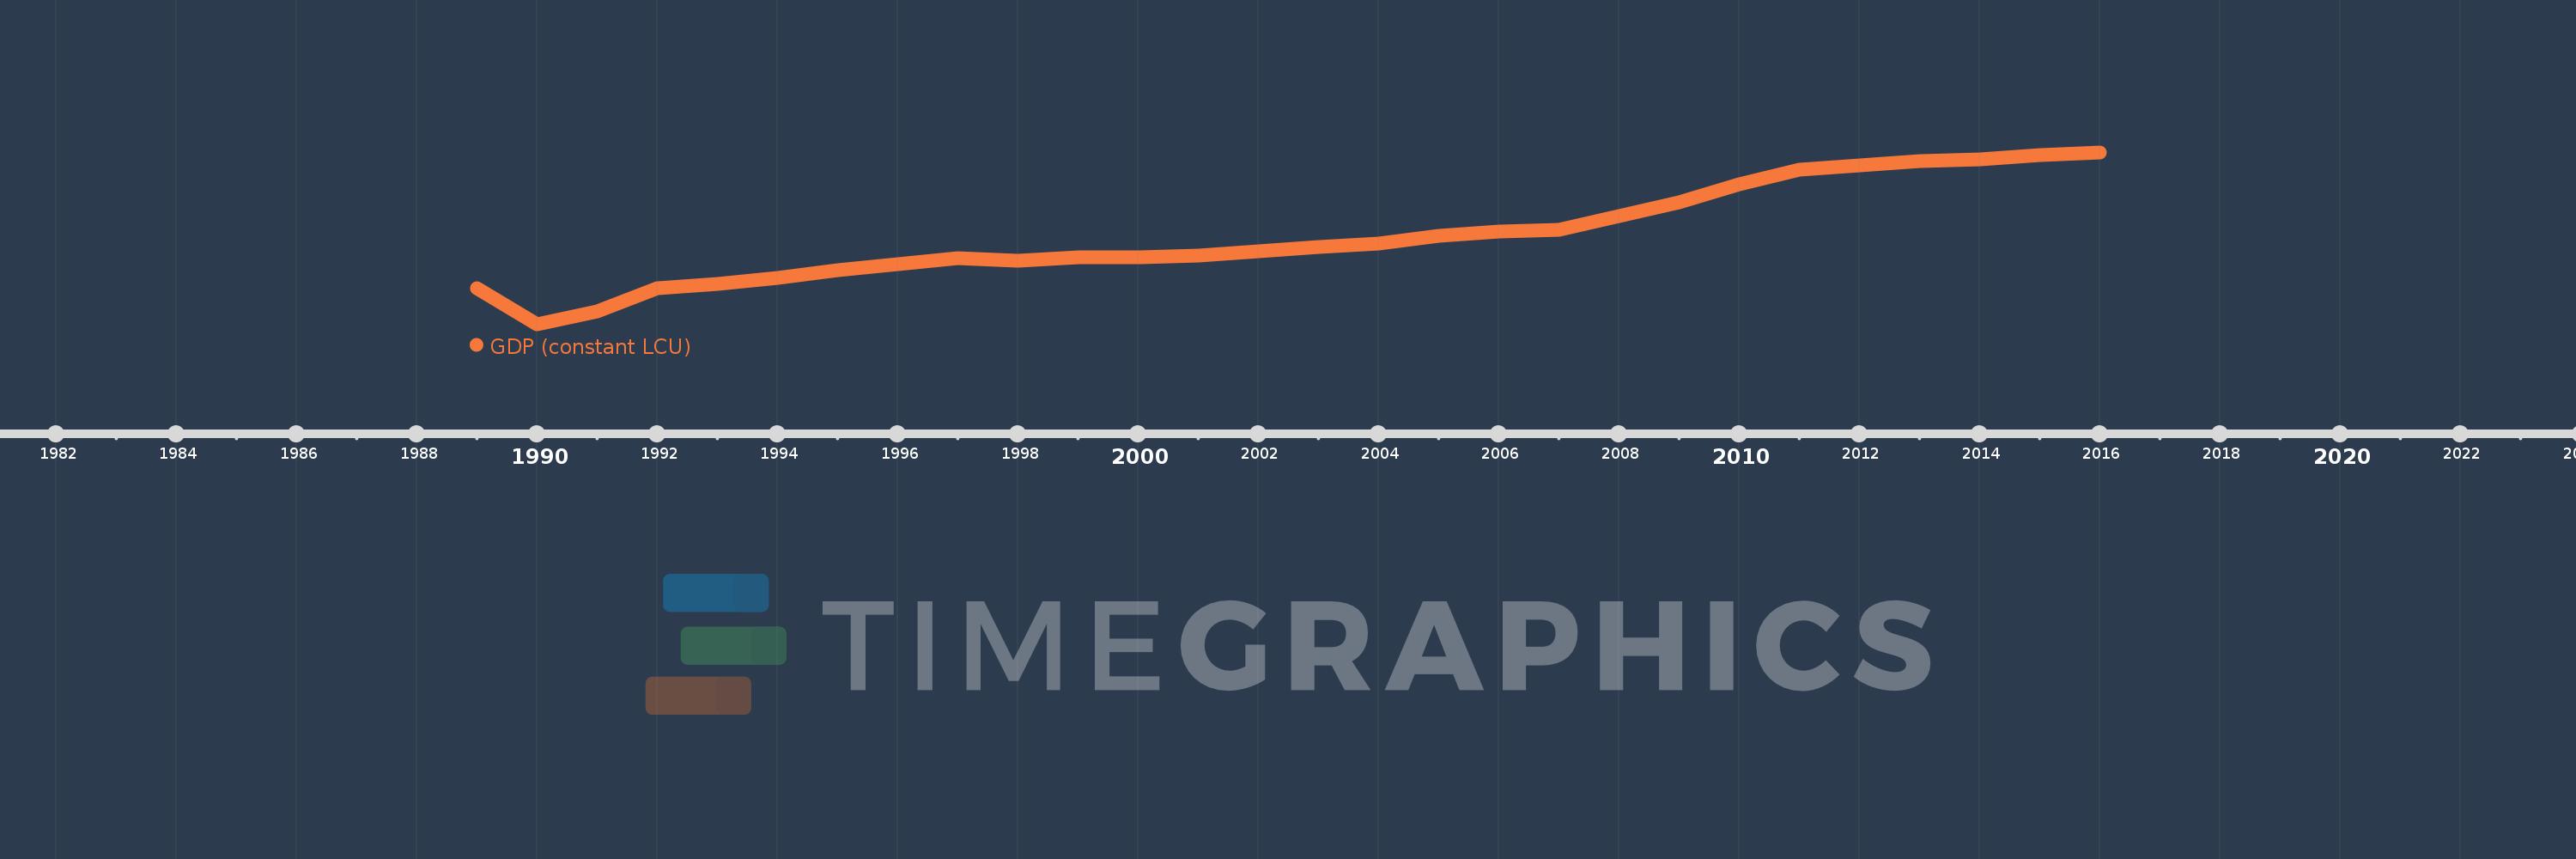
Questa scala temporale mostra un grafico dal 1989 anno al 2016 anno. Lebanon. I dati fino ad 1988 anno non disponibili. Il numero di osservazioni attuali secondo i date: 28.

La fonte (nome):

Indicatori dello sviluppo mondiale

La fonte (organizzazione):

World Bank national accounts data, and OECD National Accounts data files.

Categorie:

Economy & Growth

sono stati aggiornati

23 apr 2017 anni

Indicatori delle variazioni dei valori per anni

In media:
38.58 Trln
Minima:
13.625 Trln
1 gen 1990 anni
Massimo:
62.141 Trln
1 gen 2016 anni
Alla data di osservazione
Valore
Variazione assoluta
La variazione rispetto al valore precedente
1 gen 1989 anni
23.675 Trln
+23.675 Trln
0.0%
1 gen 1990 anni
13.625 Trln
-10.051 Trln
-42.45%
1 gen 1991 anni
17.24 Trln
+3.615 Trln
26.53%
1 gen 1992 anni
23.826 Trln
+6.586 Trln
38.2%
1 gen 1993 anni
24.898 Trln
+1.072 Trln
4.5%
1 gen 1994 anni
26.64 Trln
+1.742 Trln
7.0%
1 gen 1995 anni
28.773 Trln
+2.132 Trln
8.0%
1 gen 1996 anni
30.653 Trln
+1.88 Trln
6.53%
1 gen 1997 anni
32.227 Trln
+1.574 Trln
5.14%
1 gen 1998 anni
31.49 Trln
-736.969 Mlrd
-2.29%
1 gen 1999 anni
32.622 Trln
+1.131 Trln
3.59%
1 gen 2000 anni
32.474 Trln
-147.8 Mlrd
-0.45%
1 gen 2001 anni
32.91 Trln
+436.47 Mlrd
1.34%
1 gen 2002 anni
34.184 Trln
+1.274 Trln
3.87%
1 gen 2003 anni
35.352 Trln
+1.167 Trln
3.42%
1 gen 2004 anni
36.491 Trln
+1.139 Trln
3.22%
1 gen 2005 anni
38.649 Trln
+2.158 Trln
5.91%
1 gen 2006 anni
39.705 Trln
+1.056 Trln
2.73%
1 gen 2007 anni
40.323 Trln
+618.0 Mlrd
1.56%
1 gen 2008 anni
44.093 Trln
+3.77 Trln
9.35%
1 gen 2009 anni
48.117 Trln
+4.024 Trln
9.13%
1 gen 2010 anni
53.075 Trln
+4.958 Trln
10.3%
1 gen 2011 anni
57.3 Trln
+4.225 Trln
7.96%
1 gen 2012 anni
58.436 Trln
+1.136 Trln
1.98%
1 gen 2013 anni
59.722 Trln
+1.286 Trln
2.2%
1 gen 2014 anni
60.259 Trln
+537.494 Mlrd
0.9%
1 gen 2015 anni
61.344 Trln
+1.085 Trln
1.8%
1 gen 2016 anni
62.141 Trln
+797.469 Mlrd
1.3%

Classificazione dei paesi secondo i statistiche attuali per anni