33
/it/
AIzaSyAYiBZKx7MnpbEhh9jyipgxe19OcubqV5w
May 1, 2025
117892
Czech Republic
CZE
true
2
1
GDP (constant LCU)
2016,2015,2014,2013,2012,2011,2010,2009,2008,2007,2006,2005,2004,2003,2002,2001,2000,1999,1998,1997,1996,1995,1994,1993,1992,1991
Download
Biblioteca di statistiche globali →Czech Republic →

GDP (constant LCU)

Queste statistiche in altri paesi:

AfghanistanAlbaniaAlgeriaAndorraAngolaAntigua and BarbudaArgentinaArmeniaArubaAustraliaAustriaAzerbaijanBahamas, TheBahrainBangladeshBarbadosBelarusBelgiumBelizeBeninBermudaBhutanBoliviaBosnia and HerzegovinaBotswanaBrazilBrunei DarussalamBulgariaBurkina FasoBurundiCabo VerdeCambodiaCameroonCanadaCayman IslandsCentral African RepublicChadChannel IslandsChileChinaColombiaComorosCongo, Dem. Rep.Congo, Rep.Costa RicaCote d'IvoireCroatiaCubaCyprusCzech RepublicDenmarkDjiboutiDominicaDominican RepublicEcuadorEgypt, Arab Rep.El SalvadorEquatorial GuineaEritreaEstoniaEthiopiaFijiFinlandFranceFrench PolynesiaGabonGambia, TheGeorgiaGermanyGhanaGreeceGreenlandGrenadaGuatemalaGuineaGuinea-BissauGuyanaHaitiHondurasHong Kong SAR, ChinaHungaryIcelandIndiaIndonesiaIran, Islamic Rep.IraqIrelandIsle of ManIsraelItalyJamaicaJapanJordanKazakhstanKenyaKiribatiKorea, Rep.KosovoKuwaitKyrgyz RepublicLao PDRLatviaLebanonLesothoLiberiaLibyaLiechtensteinLithuaniaLuxembourgMacao SAR, ChinaMacedonia, FYRMadagascarMalawiMalaysiaMaldivesMaliMaltaMarshall IslandsMauritaniaMauritiusMexicoMicronesia, Fed. Sts.MoldovaMonacoMongoliaMontenegroMoroccoMozambiqueMyanmarNamibiaNauruNepalNetherlandsNew CaledoniaNew ZealandNicaraguaNigerNigeriaNorwayOmanPakistanPalauPanamaPapua New GuineaParaguayPeruPhilippinesPolandPortugalPuerto RicoQatarRomaniaRussian FederationRwandaSamoaSan MarinoSao Tome and PrincipeSaudi ArabiaSenegalSerbiaSeychellesSierra LeoneSingaporeSlovak RepublicSloveniaSolomon IslandsSomaliaSouth AfricaSouth SudanSpainSri LankaSt. Kitts and NevisSt. LuciaSt. Vincent and the GrenadinesSudanSurinameSwazilandSwedenSwitzerlandSyrian Arab RepublicTajikistanTanzaniaThailandTimor-LesteTogoTongaTrinidad and TobagoTunisiaTurkeyTurkmenistanTuvaluUgandaUkraineUnited Arab EmiratesUnited KingdomUnited StatesUruguayUzbekistanVanuatuVenezuela, RBVietnamVirgin Islands (U.S.)West Bank and GazaYemen, Rep.ZambiaZimbabwe

Linea del tempo:

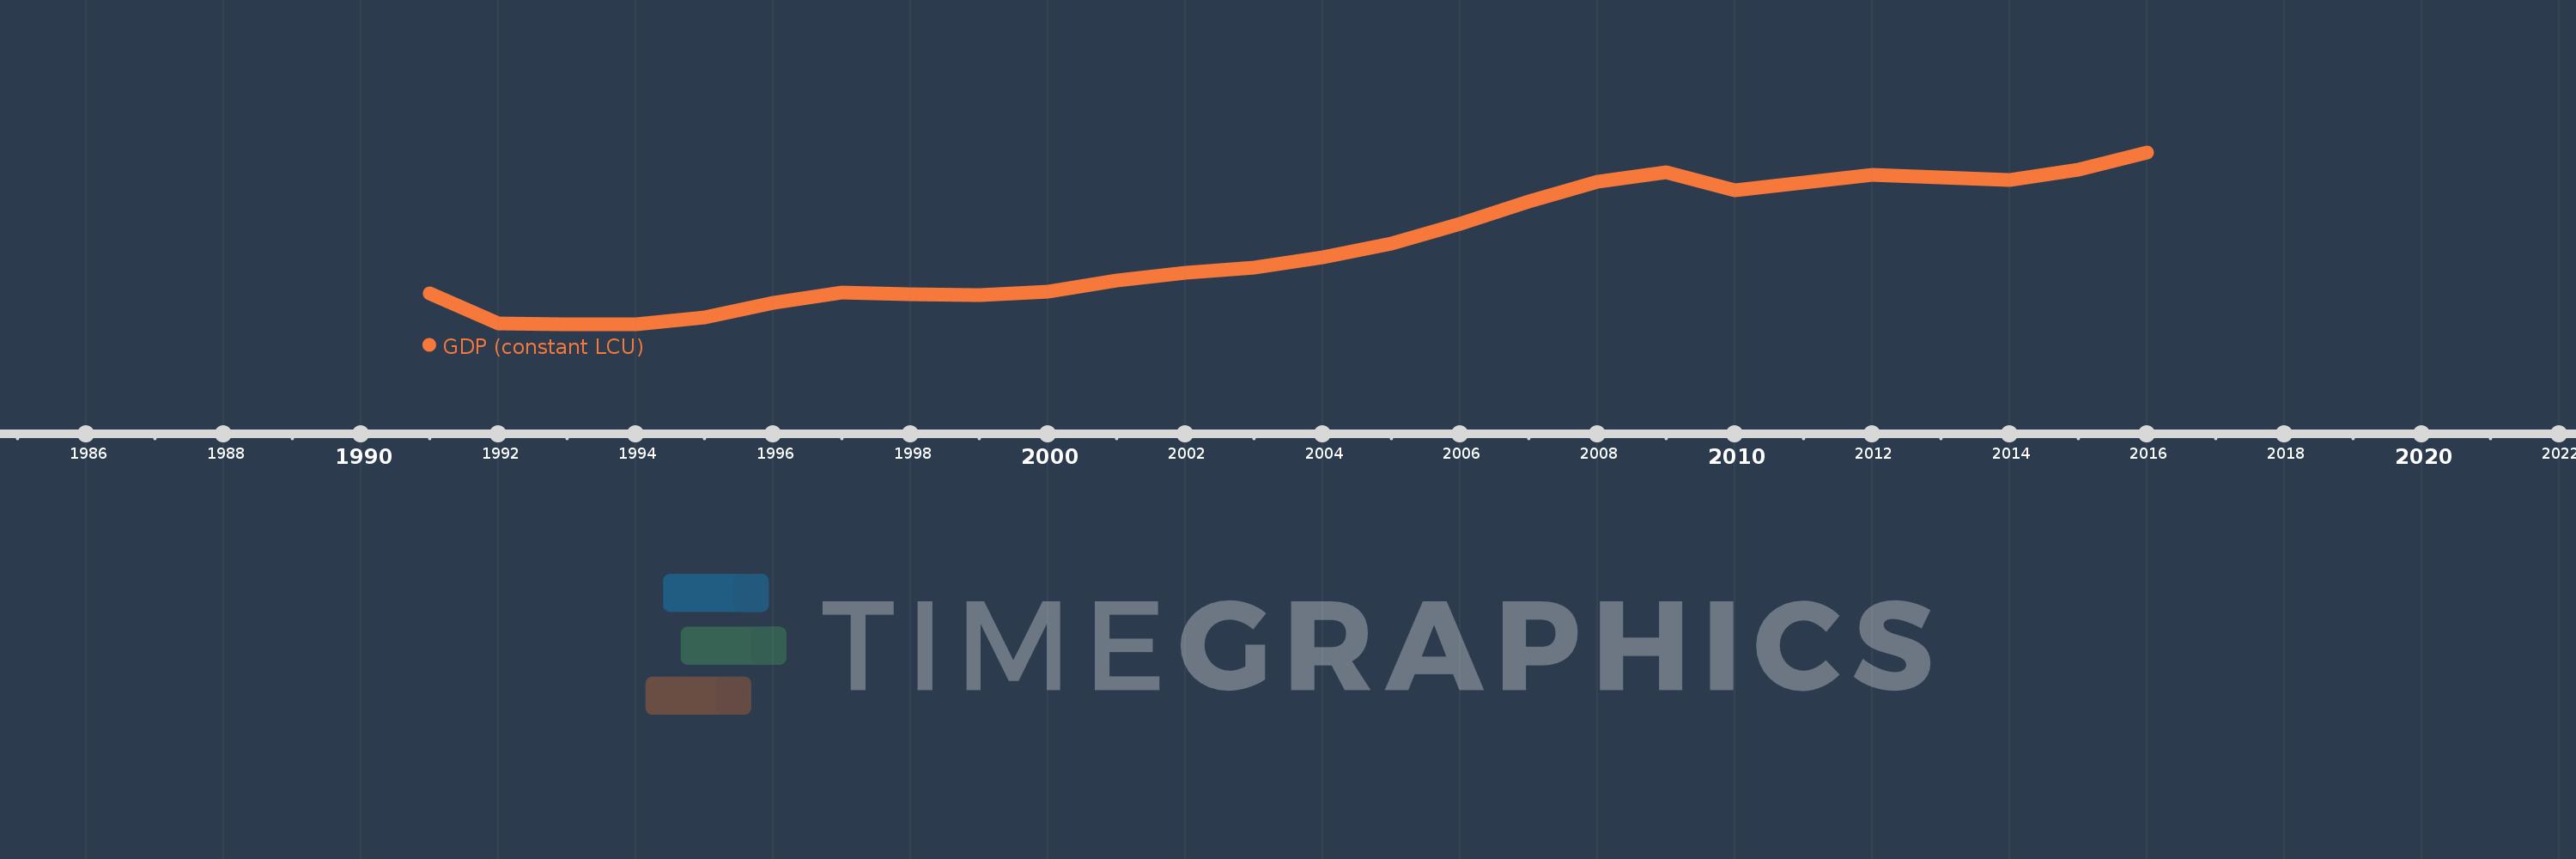
Questa scala temporale mostra un grafico dal 1991 anno al 2016 anno. Czech Republic. I dati fino ad 1990 anno non disponibili. Il numero di osservazioni attuali secondo i date: 26.

La fonte (nome):

Indicatori dello sviluppo mondiale

La fonte (organizzazione):

World Bank national accounts data, and OECD National Accounts data files.

Categorie:

Economy & Growth

sono stati aggiornati

23 apr 2017 anni

Indicatori delle variazioni dei valori per anni

In media:
3.268 Trln
Minima:
2.421 Trln
1 gen 1993 anni
Massimo:
4.275 Trln
1 gen 2016 anni
Alla data di osservazione
Valore
Variazione assoluta
La variazione rispetto al valore precedente
1 gen 1991 anni
2.753 Trln
+2.753 Trln
0.0%
1 gen 1992 anni
2.433 Trln
-319.721 Mlrd
-11.61%
1 gen 1993 anni
2.421 Trln
-12.324 Mlrd
-0.51%
1 gen 1994 anni
2.422 Trln
+1.498 Mlrd
0.06%
1 gen 1995 anni
2.493 Trln
+70.467 Mlrd
2.91%
1 gen 1996 anni
2.648 Trln
+155.074 Mlrd
6.22%
1 gen 1997 anni
2.761 Trln
+113.394 Mlrd
4.28%
1 gen 1998 anni
2.742 Trln
-18.617 Mlrd
-0.67%
1 gen 1999 anni
2.734 Trln
-8.667 Mlrd
-0.32%
1 gen 2000 anni
2.773 Trln
+39.313 Mlrd
1.44%
1 gen 2001 anni
2.892 Trln
+119.08 Mlrd
4.29%
1 gen 2002 anni
2.98 Trln
+88.255 Mlrd
3.05%
1 gen 2003 anni
3.03 Trln
+49.086 Mlrd
1.65%
1 gen 2004 anni
3.139 Trln
+109.118 Mlrd
3.6%
1 gen 2005 anni
3.294 Trln
+155.282 Mlrd
4.95%
1 gen 2006 anni
3.506 Trln
+212.202 Mlrd
6.44%
1 gen 2007 anni
3.747 Trln
+241.099 Mlrd
6.88%
1 gen 2008 anni
3.954 Trln
+207.193 Mlrd
5.53%
1 gen 2009 anni
4.062 Trln
+107.202 Mlrd
2.71%
1 gen 2010 anni
3.865 Trln
-196.654 Mlrd
-4.84%
1 gen 2011 anni
3.954 Trln
+88.704 Mlrd
2.3%
1 gen 2012 anni
4.033 Trln
+79.259 Mlrd
2.0%
1 gen 2013 anni
4.001 Trln
-32.257 Mlrd
-0.8%
1 gen 2014 anni
3.981 Trln
-19.35 Mlrd
-0.48%
1 gen 2015 anni
4.089 Trln
+108.097 Mlrd
2.72%
1 gen 2016 anni
4.275 Trln
+185.48 Mlrd
4.54%

Classificazione dei paesi secondo i statistiche attuali per anni