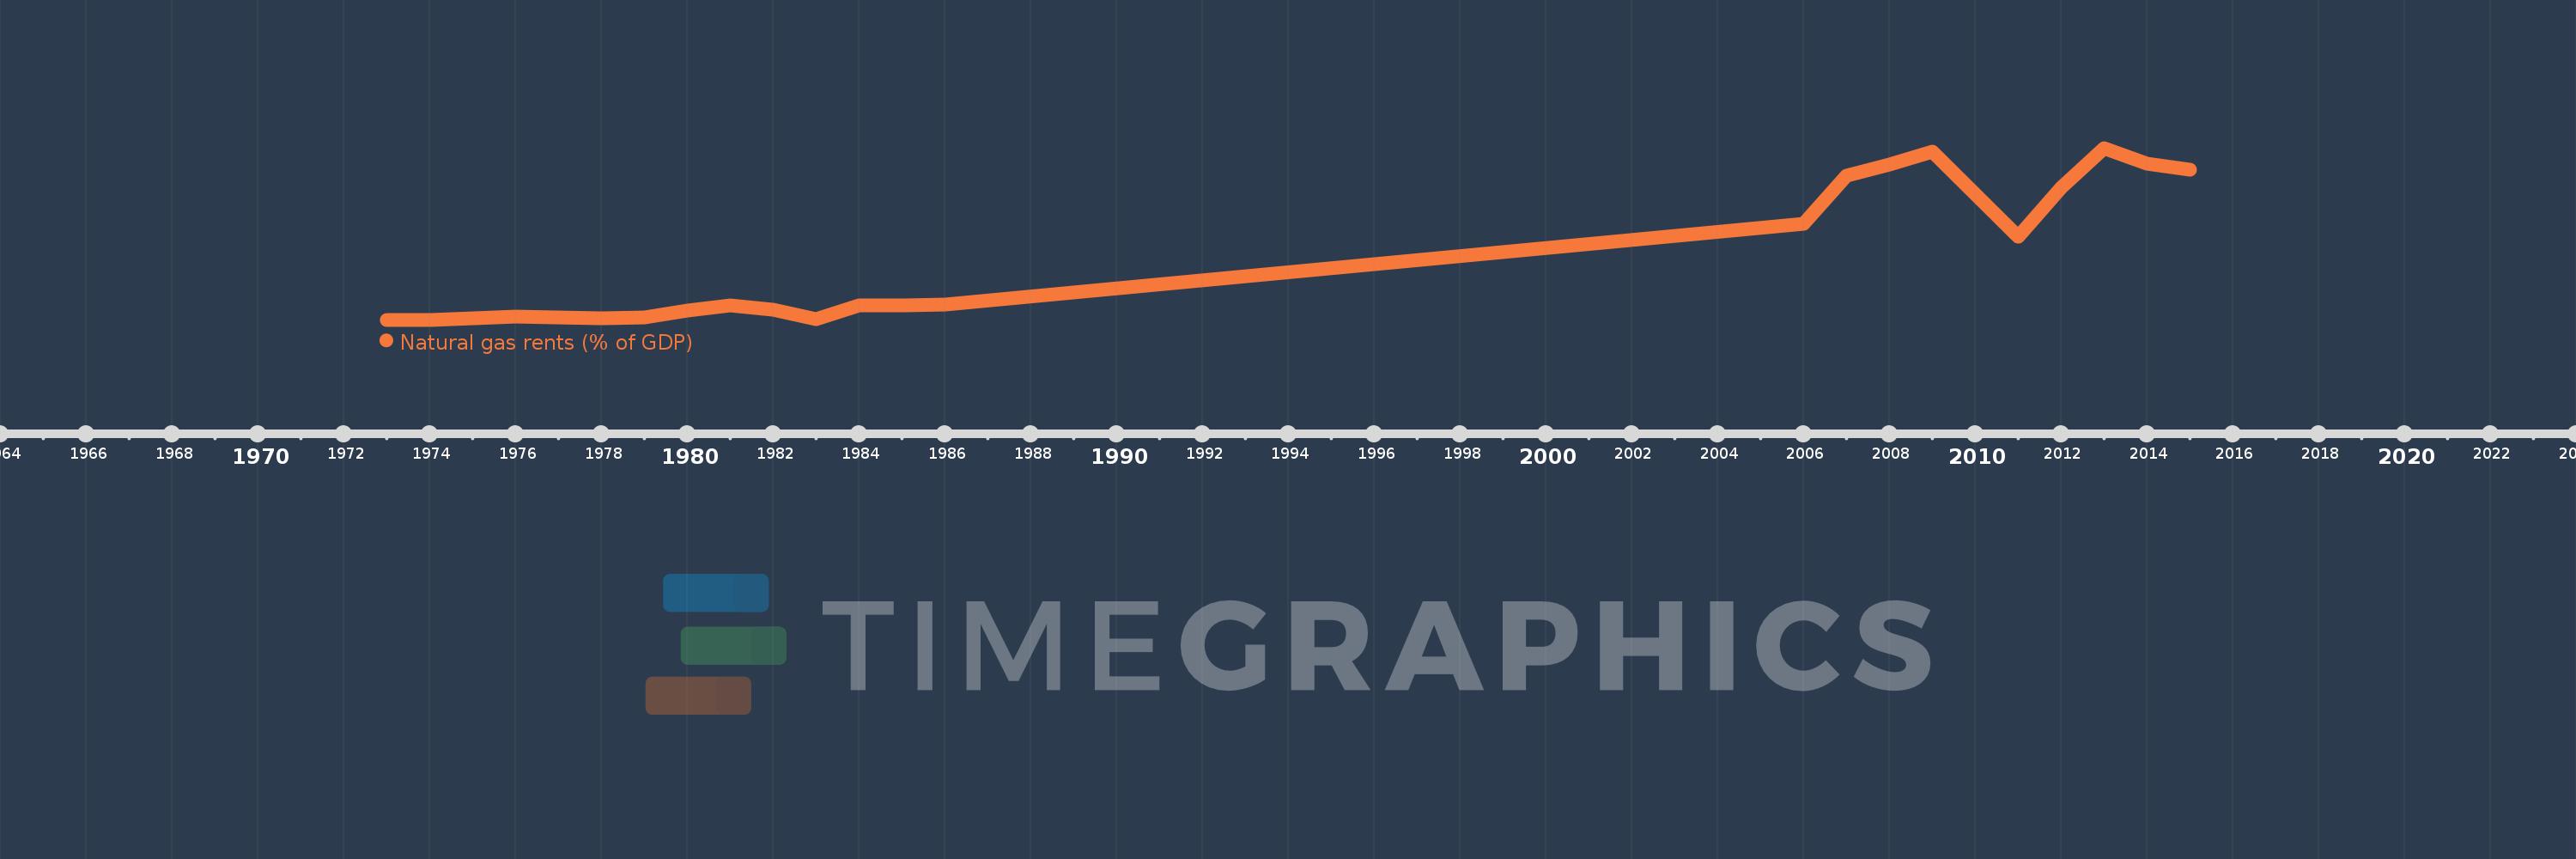
Questa scala temporale mostra un grafico dal 1973 anno al 2015 anno. Caribbean small states. I dati fino ad 1972 anno non disponibili. Il numero di osservazioni attuali secondo i date: 23.
La fonte (nome):
Indicatori dello sviluppo mondiale
La fonte (organizzazione):
Estimates based on sources and methods described in "The Changing Wealth of Nations: Measuring Sustainable Development in the New Millennium" (World Bank, 2011).
Categorie:
Energy & Mining, Environment
sono stati aggiornati
23 apr 2017 anni
Indicatori delle variazioni dei valori per anni
In media:
2.235
Minima:
0.0
1 gen 1973 anni
Massimo:
6.559
1 gen 2013 anni
Alla data di osservazione
Valore
Variazione assoluta
La variazione rispetto al valore precedente
1 gen 1973 anni
0.0
0.0
0.0%
1 gen 1974 anni
0.0
0.0
%
1 gen 1975 anni
0.048
+0.048
%
1 gen 1976 anni
0.129
+0.081
168.81%
1 gen 1977 anni
0.098
-0.031
-23.84%
1 gen 1978 anni
0.069
-0.029
-29.92%
1 gen 1979 anni
0.094
+0.026
37.46%
1 gen 1980 anni
0.358
+0.263
279.23%
1 gen 1981 anni
0.54
+0.182
50.96%
1 gen 1982 anni
0.383
-0.157
-29.06%
1 gen 1983 anni
0.035
-0.348
-90.82%
1 gen 1984 anni
0.534
+0.499
1.42 Mille.%
1 gen 1985 anni
0.55
+0.016
3.01%
1 gen 1986 anni
0.587
+0.037
6.8%
1 gen 2006 anni
3.67
+3.082
524.66%
1 gen 2007 anni
5.502
+1.832
49.93%
1 gen 2008 anni
5.941
+0.439
7.98%
1 gen 2009 anni
6.43
+0.489
8.23%
1 gen 2011 anni
3.175
-3.254
-50.62%
1 gen 2012 anni
5.027
+1.852
58.34%
1 gen 2013 anni
6.559
+1.532
30.47%
1 gen 2014 anni
5.951
-0.608
-9.27%
1 gen 2015 anni
5.717
-0.234
-3.93%
Classificazione dei paesi secondo i statistiche attuali per anni