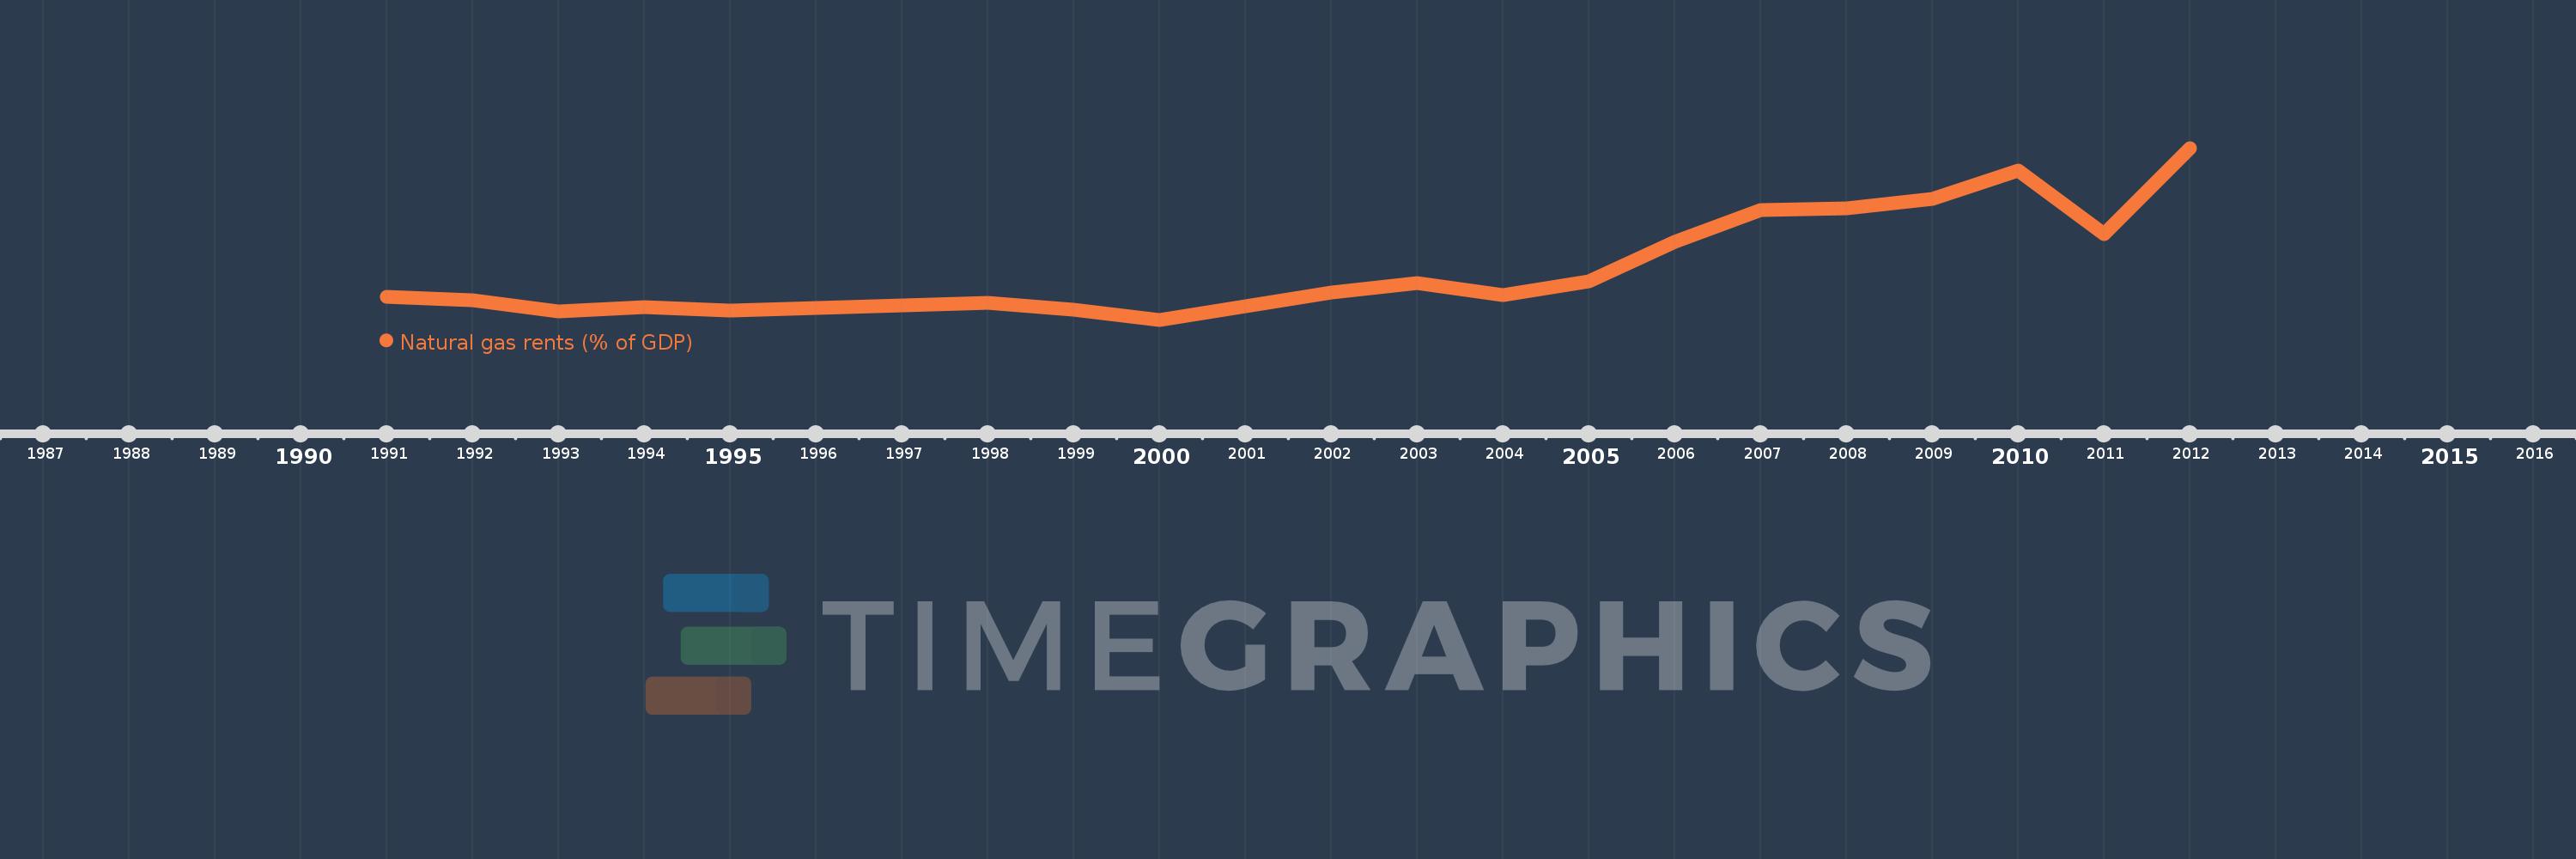
Questa scala temporale mostra un grafico dal 1991 anno al 2012 anno. Libya. I dati fino ad 1990 anno non disponibili. Il numero di osservazioni attuali secondo i date: 22.
La fonte (nome):
Indicatori dello sviluppo mondiale
La fonte (organizzazione):
Estimates based on sources and methods described in "The Changing Wealth of Nations: Measuring Sustainable Development in the New Millennium" (World Bank, 2011).
Categorie:
Energy & Mining, Environment
sono stati aggiornati
23 apr 2017 anni
Indicatori delle variazioni dei valori per anni
In media:
0.523
Minima:
0.108
1 gen 2000 anni
Massimo:
1.541
1 gen 2012 anni
Alla data di osservazione
Valore
Variazione assoluta
La variazione rispetto al valore precedente
1 gen 1991 anni
0.302
+0.302
0.0%
1 gen 1992 anni
0.271
-0.031
-10.21%
1 gen 1993 anni
0.181
-0.09
-33.29%
1 gen 1994 anni
0.211
+0.03
16.68%
1 gen 1995 anni
0.183
-0.028
-13.18%
1 gen 1996 anni
0.207
+0.024
13.15%
1 gen 1997 anni
0.23
+0.022
10.85%
1 gen 1998 anni
0.251
+0.021
9.24%
1 gen 1999 anni
0.19
-0.061
-24.37%
1 gen 2000 anni
0.108
-0.082
-43.15%
1 gen 2001 anni
0.222
+0.114
105.66%
1 gen 2002 anni
0.338
+0.116
52.48%
1 gen 2003 anni
0.417
+0.079
23.22%
1 gen 2004 anni
0.311
-0.106
-25.35%
1 gen 2005 anni
0.431
+0.12
38.45%
1 gen 2006 anni
0.761
+0.33
76.64%
1 gen 2007 anni
1.026
+0.265
34.8%
1 gen 2008 anni
1.038
+0.013
1.22%
1 gen 2009 anni
1.115
+0.077
7.42%
1 gen 2010 anni
1.355
+0.239
21.47%
1 gen 2011 anni
0.824
-0.53
-39.14%
1 gen 2012 anni
1.541
+0.717
86.97%
Classificazione dei paesi secondo i statistiche attuali per anni