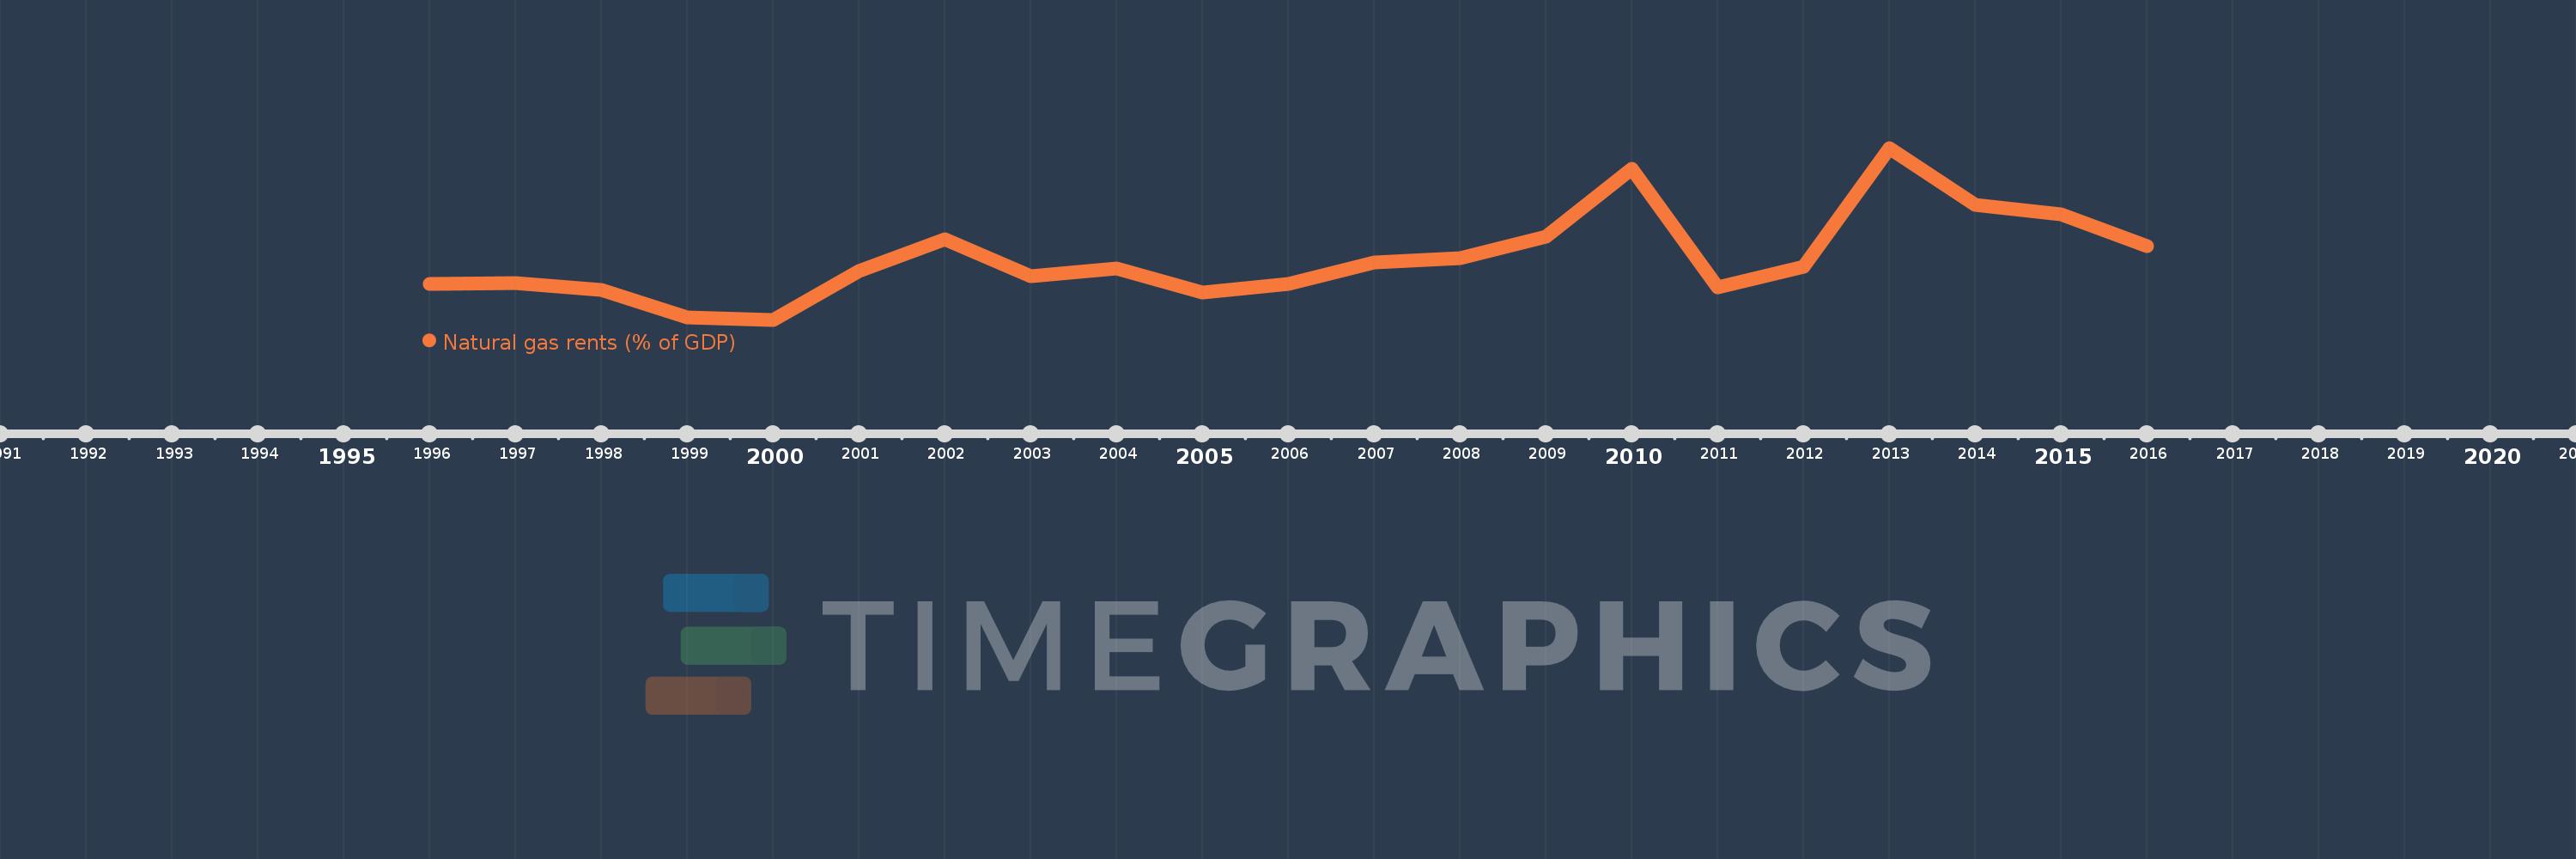
Questa scala temporale mostra un grafico dal 1996 anno al 2016 anno. Croatia. I dati fino ad 1995 anno non disponibili. Il numero di osservazioni attuali secondo i date: 21.
La fonte (nome):
Indicatori dello sviluppo mondiale
La fonte (organizzazione):
Estimates based on sources and methods described in "The Changing Wealth of Nations: Measuring Sustainable Development in the New Millennium" (World Bank, 2011).
Categorie:
Energy & Mining, Environment
sono stati aggiornati
23 apr 2017 anni
Indicatori delle variazioni dei valori per anni
In media:
0.234
Minima:
0.059
1 gen 2000 anni
Massimo:
0.548
1 gen 2013 anni
Alla data di osservazione
Valore
Variazione assoluta
La variazione rispetto al valore precedente
1 gen 1996 anni
0.16
+0.16
0.0%
1 gen 1997 anni
0.164
+0.004
2.43%
1 gen 1998 anni
0.144
-0.021
-12.51%
1 gen 1999 anni
0.065
-0.079
-54.95%
1 gen 2000 anni
0.059
-0.005
-8.16%
1 gen 2001 anni
0.197
+0.137
230.92%
1 gen 2002 anni
0.287
+0.09
45.91%
1 gen 2003 anni
0.183
-0.104
-36.16%
1 gen 2004 anni
0.204
+0.021
11.19%
1 gen 2005 anni
0.136
-0.068
-33.49%
1 gen 2006 anni
0.162
+0.026
19.24%
1 gen 2007 anni
0.222
+0.06
37.09%
1 gen 2008 anni
0.235
+0.014
6.13%
1 gen 2009 anni
0.295
+0.059
25.26%
1 gen 2010 anni
0.488
+0.193
65.49%
1 gen 2011 anni
0.151
-0.337
-69.13%
1 gen 2012 anni
0.21
+0.06
39.59%
1 gen 2013 anni
0.548
+0.337
160.57%
1 gen 2014 anni
0.385
-0.163
-29.78%
1 gen 2015 anni
0.36
-0.025
-6.45%
1 gen 2016 anni
0.269
-0.09
-25.11%
Classificazione dei paesi secondo i statistiche attuali per anni