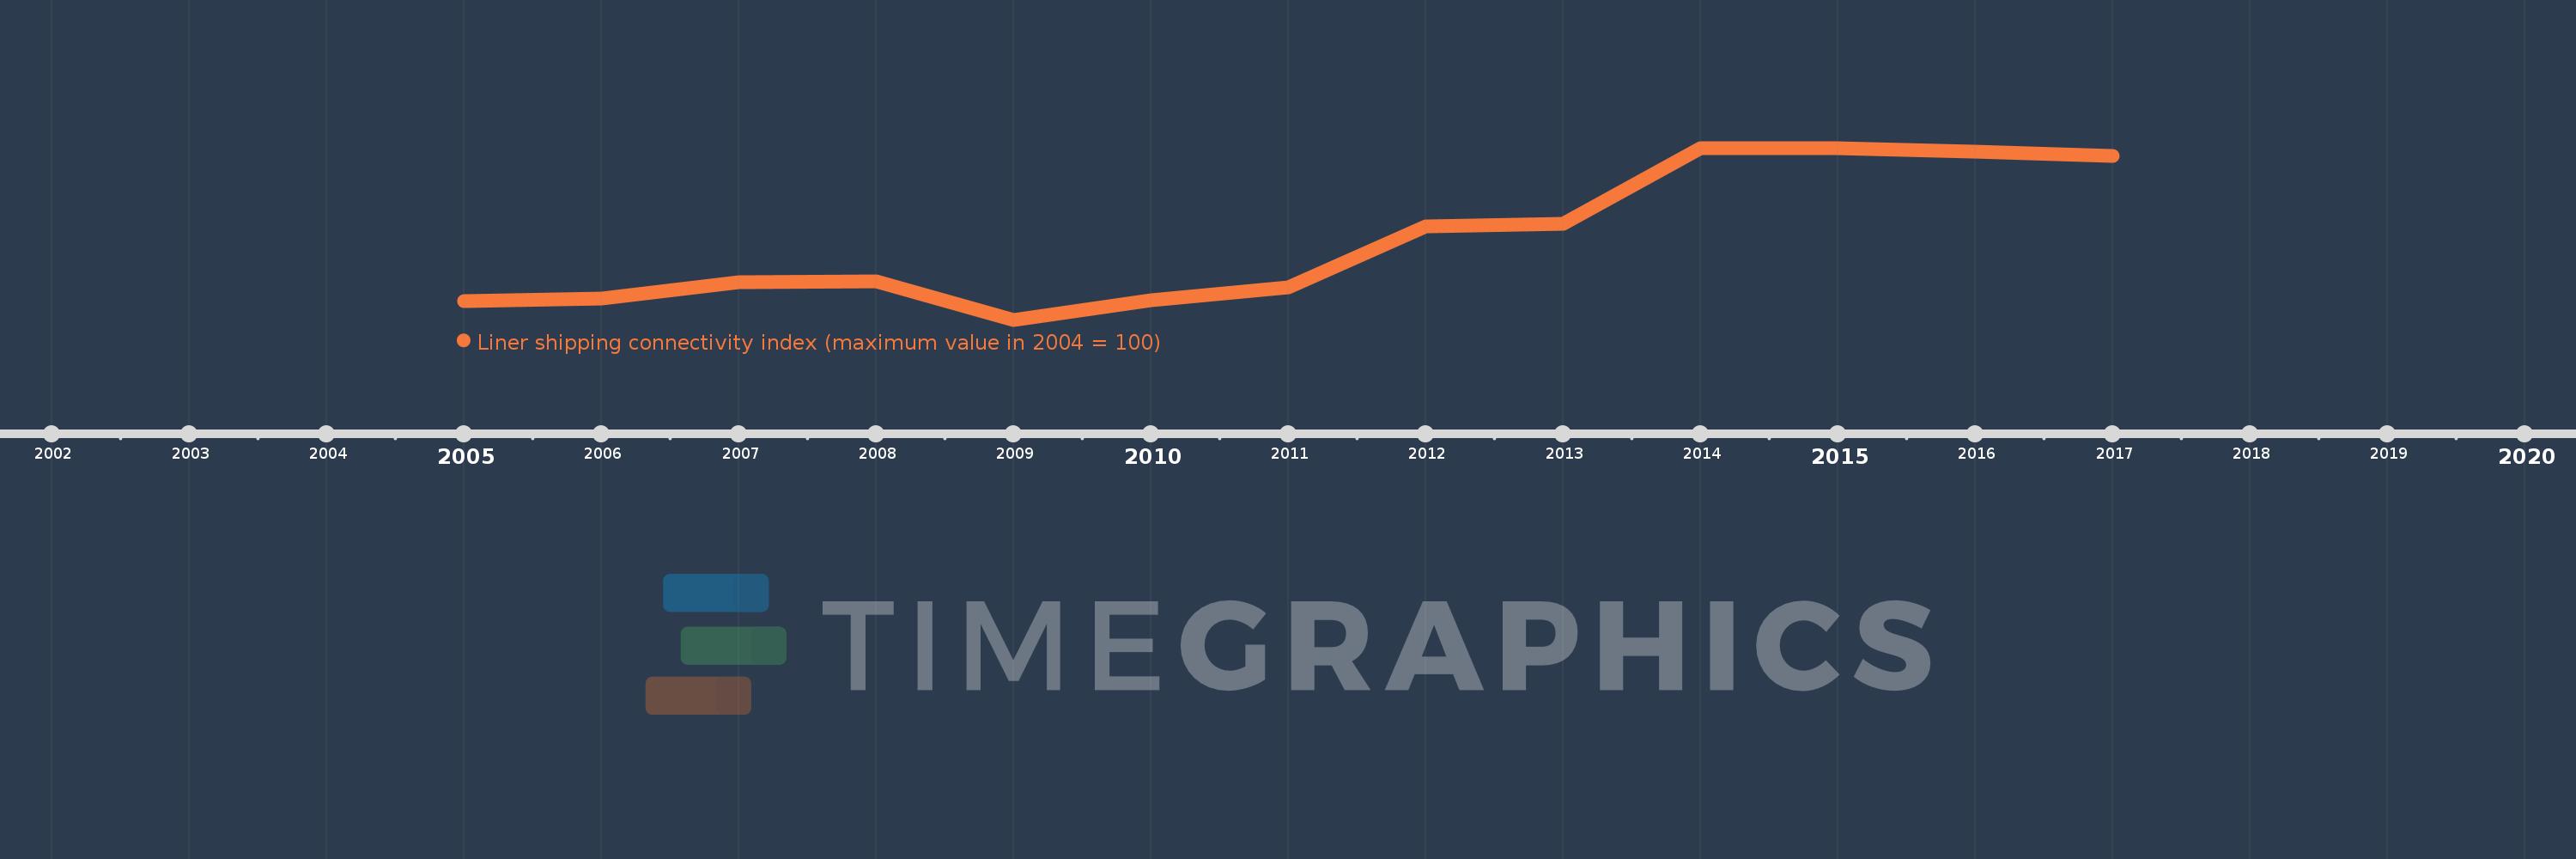
Questa scala temporale mostra un grafico dal 2005 anno al 2017 anno. Seychelles. I dati fino ad 2004 anno non disponibili. Il numero di osservazioni attuali secondo i date: 13.
La fonte (nome):
Indicatori dello sviluppo mondiale
La fonte (organizzazione):
United Nations Conference on Trade and Development, Review of Maritime Transport 2010.
Categorie:
Infrastructure
sono stati aggiornati
23 apr 2017 anni
Indicatori delle variazioni dei valori per anni
In media:
6.15
Minima:
4.49
1 gen 2009 anni
Massimo:
8.08
1 gen 2014 anni
Alla data di osservazione
Valore
Variazione assoluta
La variazione rispetto al valore precedente
1 gen 2005 anni
4.88
+4.88
0.0%
1 gen 2006 anni
4.93
+0.05
1.02%
1 gen 2007 anni
5.27
+0.34
6.9%
1 gen 2008 anni
5.29
+0.02
0.38%
1 gen 2009 anni
4.49
-0.8
-15.12%
1 gen 2010 anni
4.9
+0.41
9.13%
1 gen 2011 anni
5.16
+0.26
5.31%
1 gen 2012 anni
6.45
+1.29
25.0%
1 gen 2013 anni
6.5
+0.05
0.78%
1 gen 2014 anni
8.08
+1.58
24.31%
1 gen 2015 anni
8.07
-0.01
-0.12%
1 gen 2016 anni
8.01
-0.06
-0.74%
1 gen 2017 anni
7.92
-0.09
-1.12%
Classificazione dei paesi secondo i statistiche attuali per anni