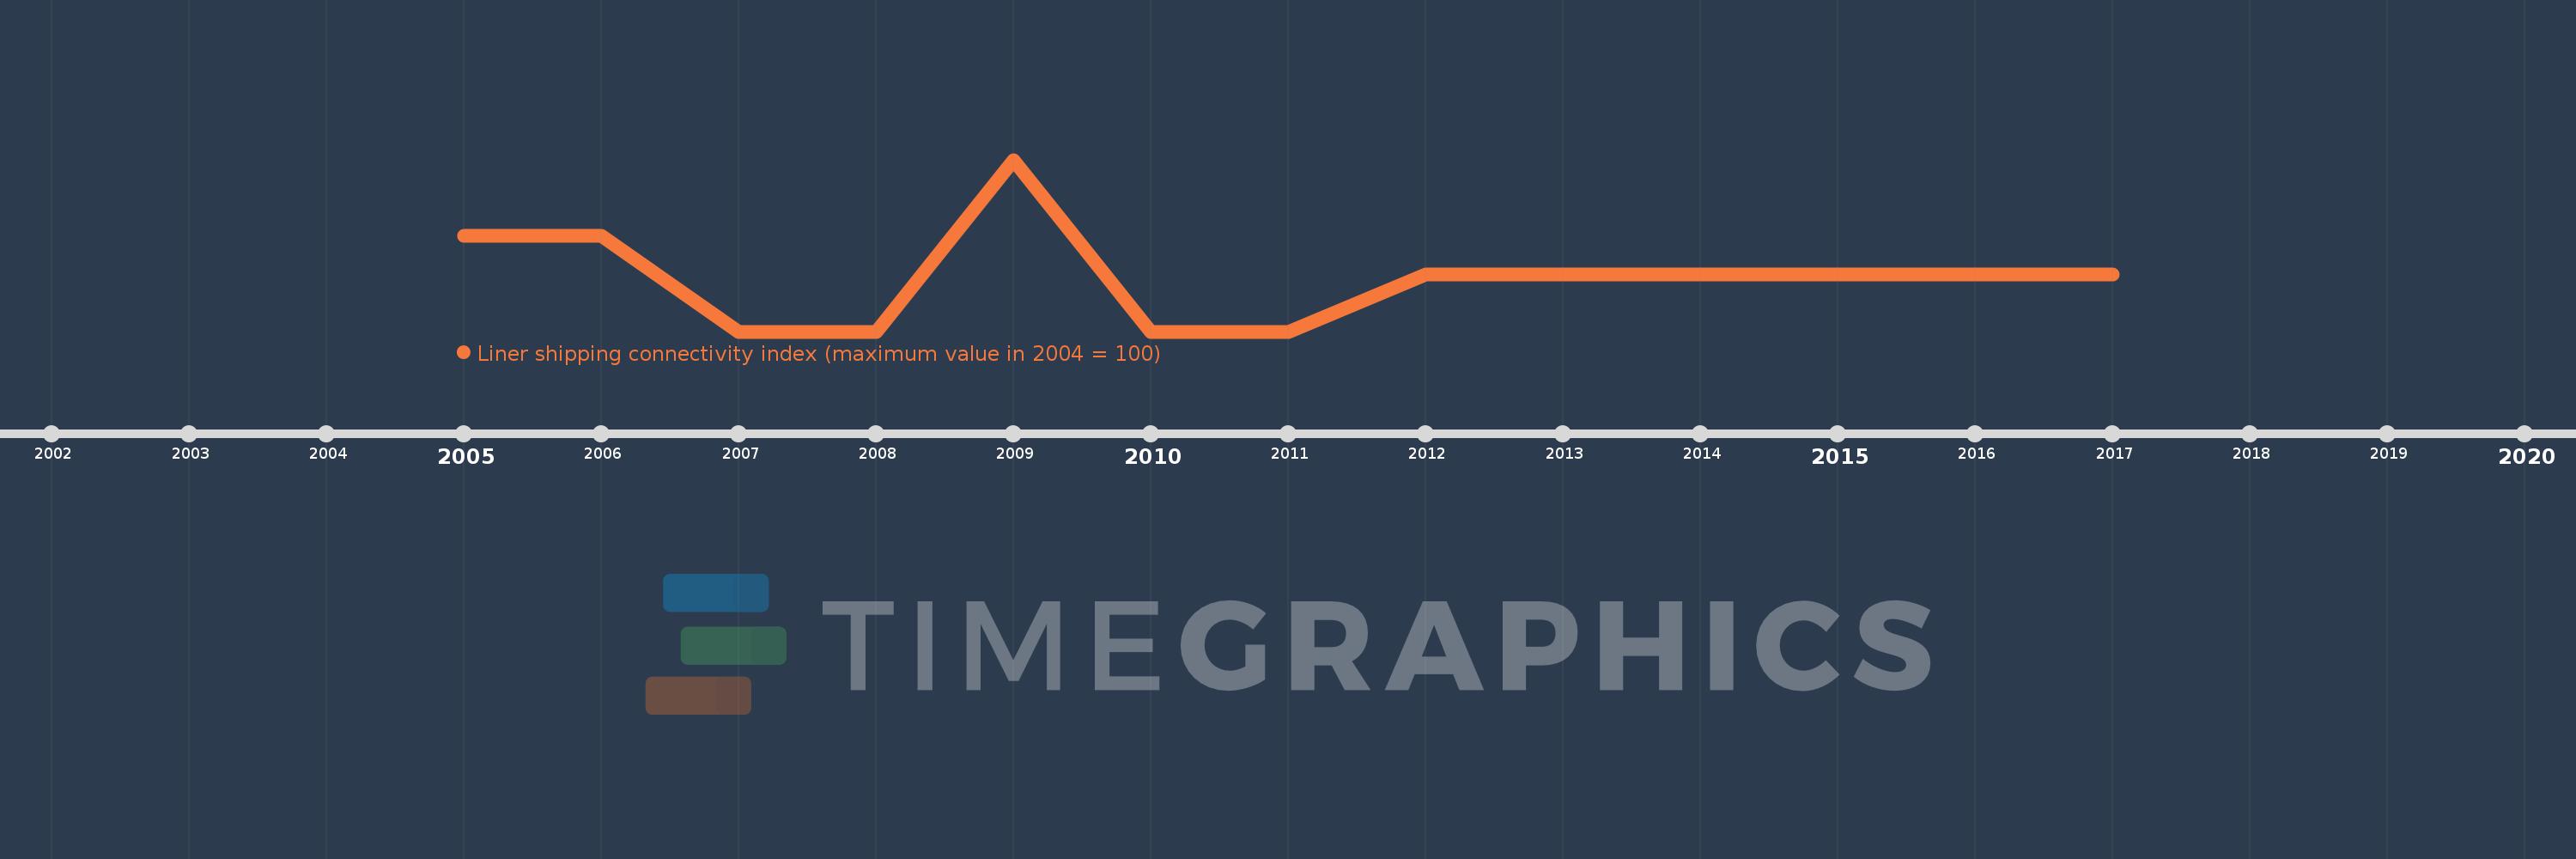
Questa scala temporale mostra un grafico dal 2005 anno al 2017 anno. Greenland. I dati fino ad 2004 anno non disponibili. Il numero di osservazioni attuali secondo i date: 13.
La fonte (nome):
Indicatori dello sviluppo mondiale
La fonte (organizzazione):
United Nations Conference on Trade and Development, Review of Maritime Transport 2010.
Categorie:
Infrastructure
sono stati aggiornati
23 apr 2017 anni
Indicatori delle variazioni dei valori per anni
In media:
2.298
Minima:
2.27
1 gen 2007 anni
Massimo:
2.36
1 gen 2009 anni
Alla data di osservazione
Valore
Variazione assoluta
La variazione rispetto al valore precedente
1 gen 2005 anni
2.32
+2.32
0.0%
1 gen 2006 anni
2.32
0.0
0.0%
1 gen 2007 anni
2.27
-0.05
-2.16%
1 gen 2008 anni
2.27
0.0
0.0%
1 gen 2009 anni
2.36
+0.09
3.96%
1 gen 2010 anni
2.27
-0.09
-3.81%
1 gen 2011 anni
2.27
0.0
0.0%
1 gen 2012 anni
2.3
+0.03
1.32%
1 gen 2013 anni
2.3
0.0
0.0%
1 gen 2014 anni
2.3
0.0
0.0%
1 gen 2015 anni
2.3
0.0
0.0%
1 gen 2016 anni
2.3
0.0
0.0%
1 gen 2017 anni
2.3
0.0
0.0%
Classificazione dei paesi secondo i statistiche attuali per anni