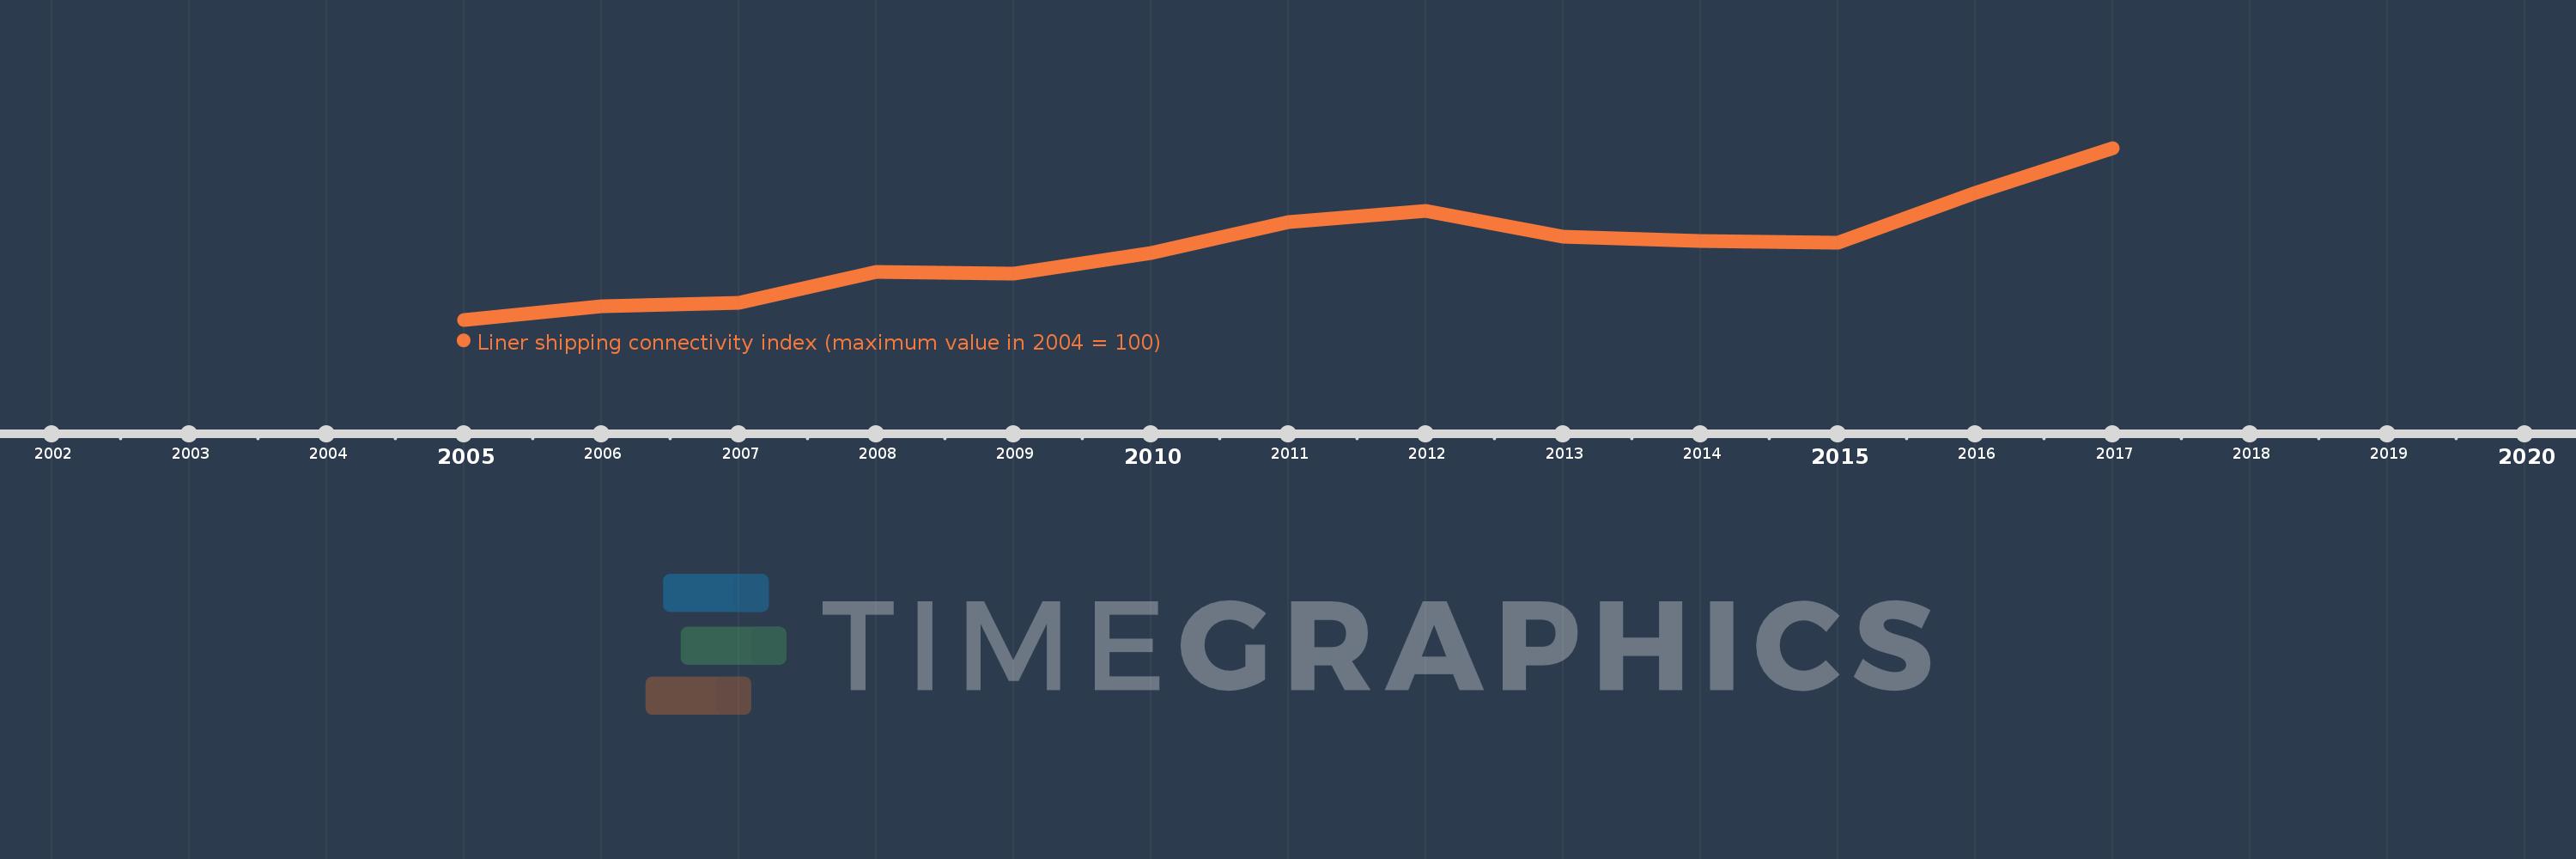
Questa scala temporale mostra un grafico dal 2005 anno al 2017 anno. Pakistan. I dati fino ad 2004 anno non disponibili. Il numero di osservazioni attuali secondo i date: 13.
La fonte (nome):
Indicatori dello sviluppo mondiale
La fonte (organizzazione):
United Nations Conference on Trade and Development, Review of Maritime Transport 2010.
Categorie:
Infrastructure
sono stati aggiornati
23 apr 2017 anni
Indicatori delle variazioni dei valori per anni
In media:
27.055
Minima:
20.18
1 gen 2005 anni
Massimo:
36.58
1 gen 2017 anni
Alla data di osservazione
Valore
Variazione assoluta
La variazione rispetto al valore precedente
1 gen 2005 anni
20.18
+20.18
0.0%
1 gen 2006 anni
21.49
+1.31
6.49%
1 gen 2007 anni
21.82
+0.33
1.54%
1 gen 2008 anni
24.77
+2.95
13.52%
1 gen 2009 anni
24.61
-0.16
-0.65%
1 gen 2010 anni
26.58
+1.97
8.0%
1 gen 2011 anni
29.48
+2.9
10.91%
1 gen 2012 anni
30.54
+1.06
3.6%
1 gen 2013 anni
28.12
-2.42
-7.92%
1 gen 2014 anni
27.71
-0.41
-1.46%
1 gen 2015 anni
27.5
-0.21
-0.76%
1 gen 2016 anni
32.33
+4.83
17.56%
1 gen 2017 anni
36.58
+4.25
13.15%
Classificazione dei paesi secondo i statistiche attuali per anni