29
/it/
it
AIzaSyAYiBZKx7MnpbEhh9jyipgxe19OcubqV5w
April 1, 2024
222937
Peru
PER
true
2
1
Social contributions (% of revenue)
2016,2015,2014,2013,2012,2011,2010,2009,2008,2007,2006,2005,2004,2003,2002,2001,2000,1999,1998,1997,1996,1995,1994,1993,1992,1991
Download
Biblioteca di statistiche globali →Peru →

Social contributions (% of revenue)

Queste statistiche in altri paesi:
AfghanistanAlbaniaAngolaArgentinaArmeniaAustraliaAustriaAzerbaijanBarbadosBelarusBelgiumBelizeBeninBhutanBoliviaBosnia and HerzegovinaBrazilBulgariaBurundiCabo VerdeCanadaCaribbean small statesCentral African RepublicCentral Europe and the BalticsChileChinaColombiaCongo, Rep.Costa RicaCote d'IvoireCroatiaCyprusCzech RepublicDenmarkDominican RepublicEgypt, Arab Rep.El SalvadorEstoniaEthiopiaEuro areaEurope & Central AsiaEurope & Central Asia (excluding high income)Europe & Central Asia (IDA & IBRD countries)European UnionFijiFinlandFranceGambia, TheGeorgiaGermanyGhanaGreeceGuatemalaHigh incomeHondurasHong Kong SAR, ChinaHungaryIBRD onlyIcelandIDA blendIndiaIndonesiaIran, Islamic Rep.IraqIrelandIsraelItalyJamaicaJapanJordanKazakhstanKenyaKorea, Rep.Late-demographic dividendLatin America & Caribbean Latin America & Caribbean (excluding high income)Latin America & the Caribbean (IDA & IBRD countries)LatviaLebanonLiberiaLithuaniaLuxembourgMacao SAR, ChinaMacedonia, FYRMadagascarMaltaMauritiusMexicoMoldovaMongoliaMoroccoMozambiqueNamibiaNetherlandsNew ZealandNorth AmericaNorwayOECD membersPanamaPapua New GuineaParaguayPeruPolandPortugalPost-demographic dividendRomaniaRussian FederationSan MarinoSao Tome and PrincipeSerbiaSeychellesSlovak RepublicSloveniaSmall statesSouth AfricaSouth AsiaSouth Asia (IDA & IBRD)SpainSri LankaSt. Kitts and NevisSwedenSwitzerlandSyrian Arab RepublicTajikistanThailandTrinidad and TobagoTunisiaTurkeyUkraineUnited Arab EmiratesUnited KingdomUnited StatesUpper middle incomeUruguayVenezuela, RBZambiaZimbabwe
Linea del tempo:
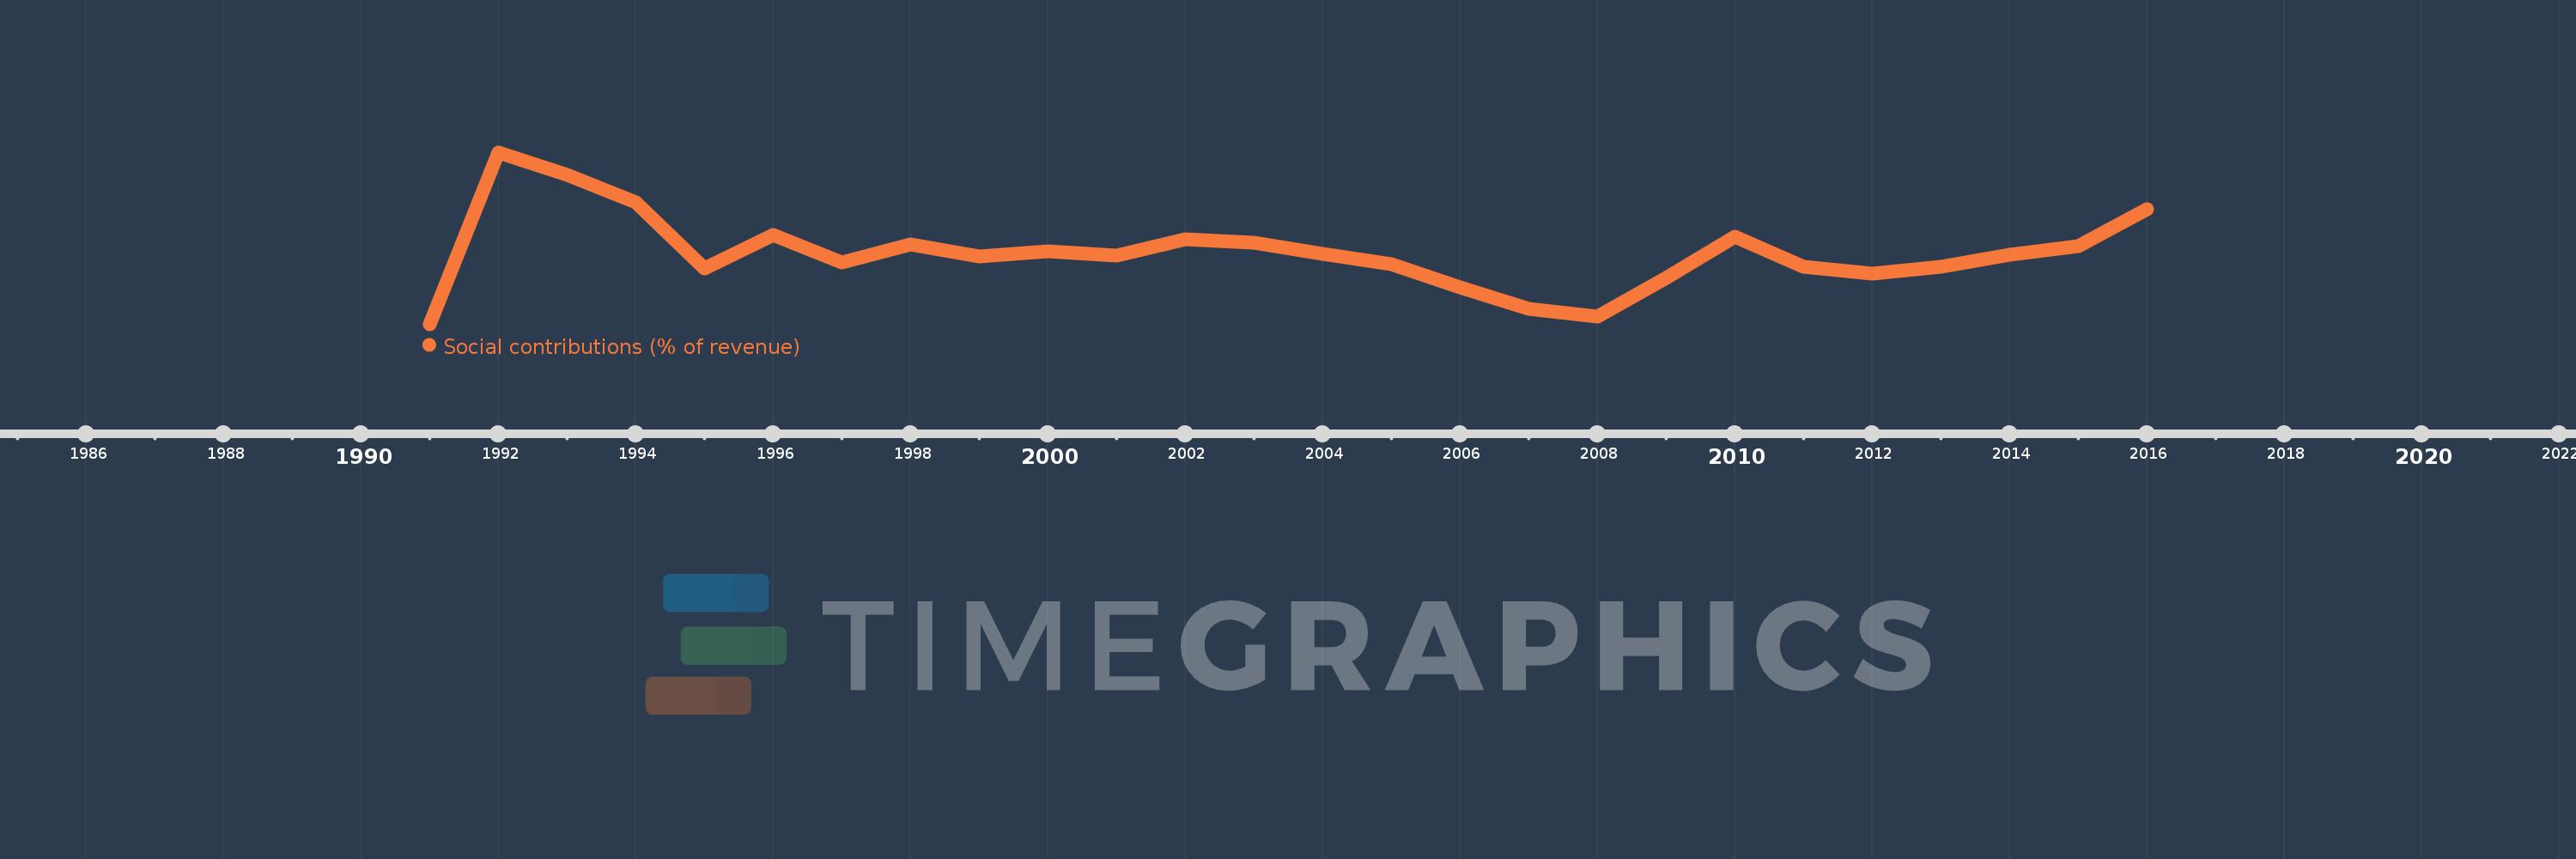
Questa scala temporale mostra un grafico dal 1991 anno al 2016 anno. Peru. I dati fino ad 1990 anno non disponibili. Il numero di osservazioni attuali secondo i date: 26.
La fonte (nome):
Indicatori dello sviluppo mondiale
La fonte (organizzazione):
International Monetary Fund, Government Finance Statistics Yearbook and data files.
Categorie:
Public Sector
sono stati aggiornati
23 apr 2017 anni
Indicatori delle variazioni dei valori per anni
In media:
9.848
Minima:
7.448
1 gen 1991 anni
Massimo:
13.212
1 gen 1992 anni
Alla data di osservazione
Valore
Variazione assoluta
La variazione rispetto al valore precedente
1 gen 1991 anni
7.448
+7.448
0.0%
1 gen 1992 anni
13.212
+5.763
77.38%
1 gen 1993 anni
12.472
-0.739
-5.6%
1 gen 1994 anni
11.549
-0.923
-7.4%
1 gen 1995 anni
9.317
-2.232
-19.33%
1 gen 1996 anni
10.45
+1.133
12.17%
1 gen 1997 anni
9.53
-0.92
-8.8%
1 gen 1998 anni
10.137
+0.607
6.37%
1 gen 1999 anni
9.729
-0.408
-4.03%
1 gen 2000 anni
9.899
+0.17
1.75%
1 gen 2001 anni
9.764
-0.135
-1.37%
1 gen 2002 anni
10.294
+0.53
5.43%
1 gen 2003 anni
10.183
-0.111
-1.08%
1 gen 2004 anni
9.822
-0.36
-3.54%
1 gen 2005 anni
9.47
-0.352
-3.58%
1 gen 2006 anni
8.672
-0.799
-8.43%
1 gen 2007 anni
7.962
-0.71
-8.19%
1 gen 2008 anni
7.711
-0.251
-3.15%
1 gen 2009 anni
9.003
+1.293
16.76%
1 gen 2010 anni
10.389
+1.386
15.39%
1 gen 2011 anni
9.373
-1.016
-9.78%
1 gen 2012 anni
9.152
-0.221
-2.36%
1 gen 2013 anni
9.365
+0.213
2.33%
1 gen 2014 anni
9.775
+0.41
4.38%
1 gen 2015 anni
10.064
+0.289
2.95%
1 gen 2016 anni
11.312
+1.248
12.41%
Classificazione dei paesi secondo i statistiche attuali per anni

Commenti:

Inviare
PremiumAbout & FeedbackAccordoPrivatezza
logo
© 2022 Selected Technologies LLC – Morgan Hill, California