29
/it/
it
AIzaSyAYiBZKx7MnpbEhh9jyipgxe19OcubqV5w
April 1, 2024
155351
India
IND
true
2
1
Social contributions (% of revenue)
2014,2013,2012,2011,2010,2009,2008,2007,2006,2005,2004,2003,2002,2001,2000,1999,1998,1997,1996,1995,1994,1993,1992,1991
Download
Biblioteca di statistiche globali →India →

Social contributions (% of revenue)

Queste statistiche in altri paesi:
AfghanistanAlbaniaAngolaArgentinaArmeniaAustraliaAustriaAzerbaijanBarbadosBelarusBelgiumBelizeBeninBhutanBoliviaBosnia and HerzegovinaBrazilBulgariaBurundiCabo VerdeCanadaCaribbean small statesCentral African RepublicCentral Europe and the BalticsChileChinaColombiaCongo, Rep.Costa RicaCote d'IvoireCroatiaCyprusCzech RepublicDenmarkDominican RepublicEgypt, Arab Rep.El SalvadorEstoniaEthiopiaEuro areaEurope & Central AsiaEurope & Central Asia (excluding high income)Europe & Central Asia (IDA & IBRD countries)European UnionFijiFinlandFranceGambia, TheGeorgiaGermanyGhanaGreeceGuatemalaHigh incomeHondurasHong Kong SAR, ChinaHungaryIBRD onlyIcelandIDA blendIndiaIndonesiaIran, Islamic Rep.IraqIrelandIsraelItalyJamaicaJapanJordanKazakhstanKenyaKorea, Rep.Late-demographic dividendLatin America & Caribbean Latin America & Caribbean (excluding high income)Latin America & the Caribbean (IDA & IBRD countries)LatviaLebanonLiberiaLithuaniaLuxembourgMacao SAR, ChinaMacedonia, FYRMadagascarMaltaMauritiusMexicoMoldovaMongoliaMoroccoMozambiqueNamibiaNetherlandsNew ZealandNorth AmericaNorwayOECD membersPanamaPapua New GuineaParaguayPeruPolandPortugalPost-demographic dividendRomaniaRussian FederationSan MarinoSao Tome and PrincipeSerbiaSeychellesSlovak RepublicSloveniaSmall statesSouth AfricaSouth AsiaSouth Asia (IDA & IBRD)SpainSri LankaSt. Kitts and NevisSwedenSwitzerlandSyrian Arab RepublicTajikistanThailandTrinidad and TobagoTunisiaTurkeyUkraineUnited Arab EmiratesUnited KingdomUnited StatesUpper middle incomeUruguayVenezuela, RBZambiaZimbabwe
Linea del tempo:
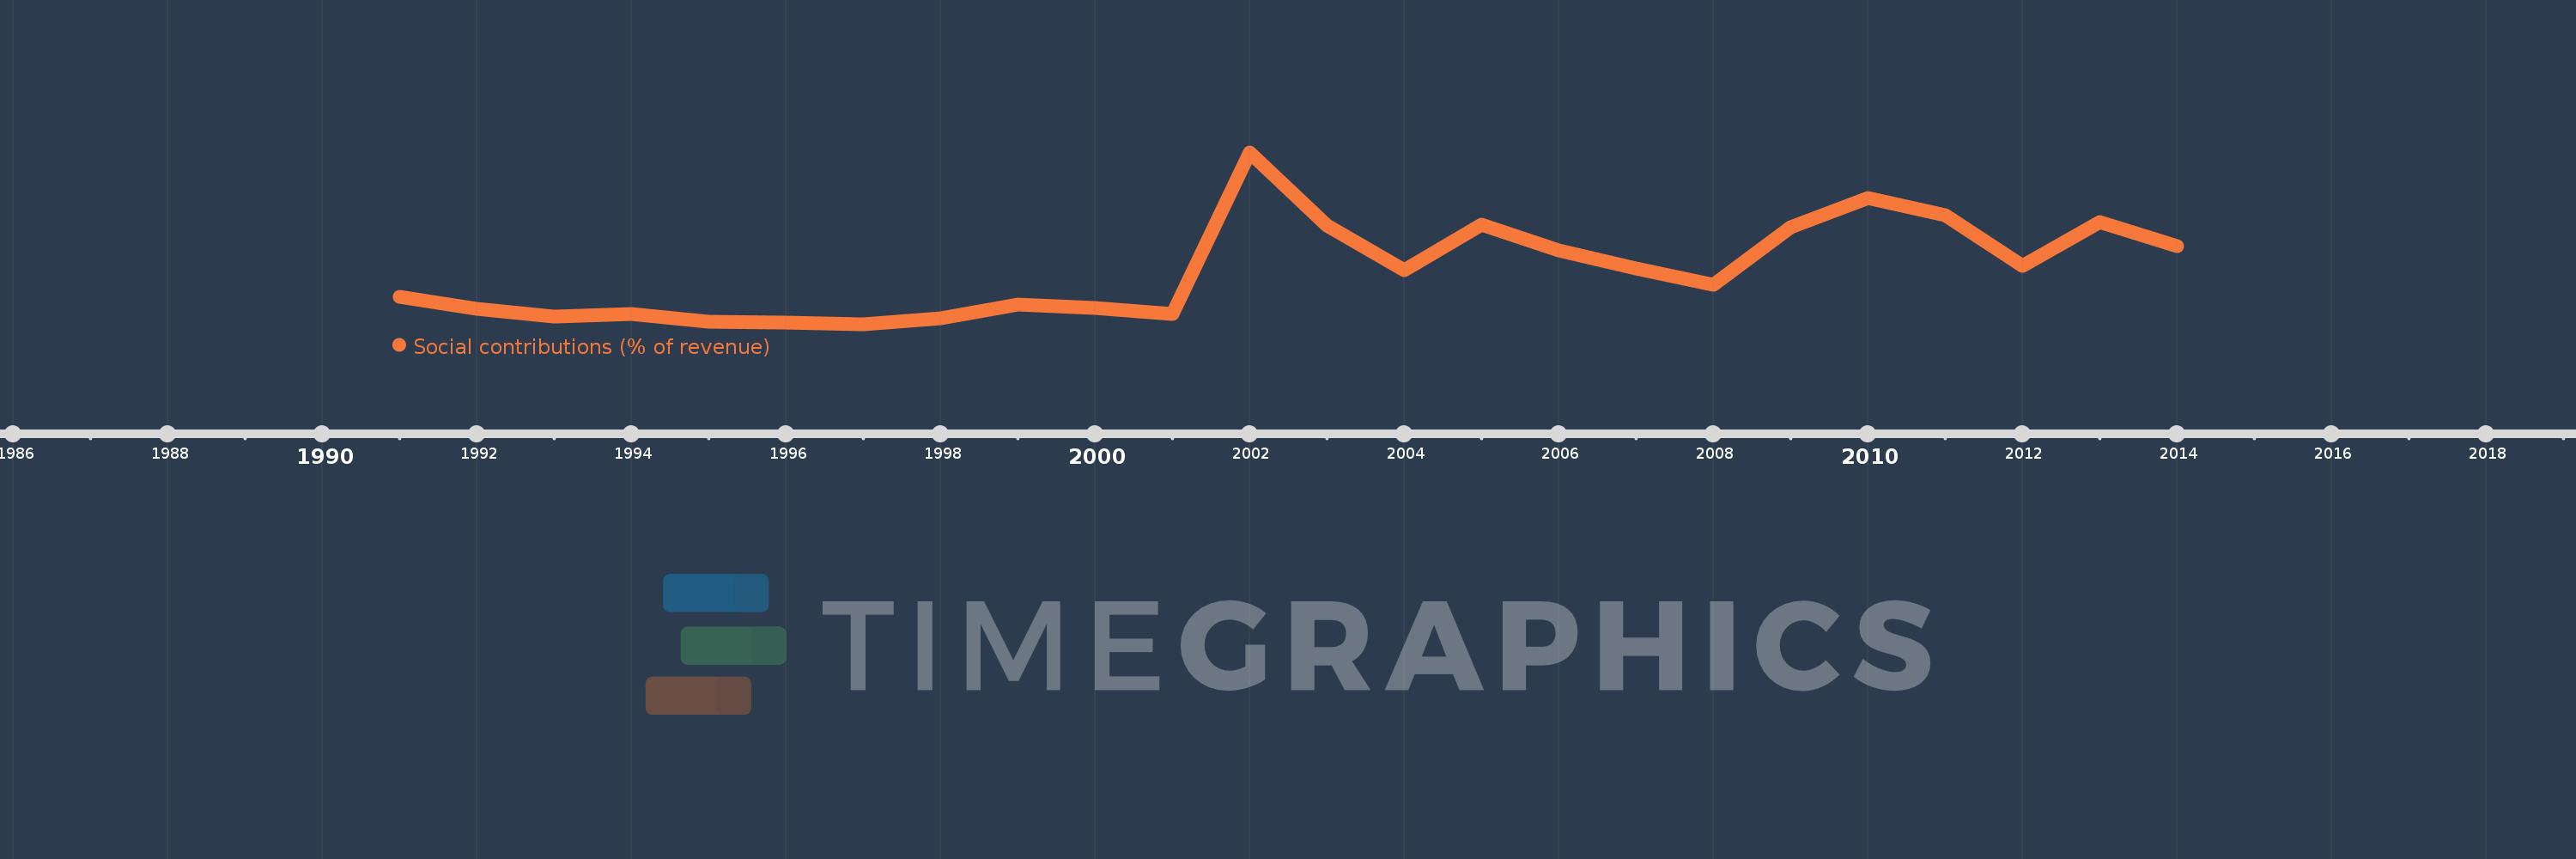
Questa scala temporale mostra un grafico dal 1991 anno al 2014 anno. India. I dati fino ad 1990 anno non disponibili. Il numero di osservazioni attuali secondo i date: 24.
La fonte (nome):
Indicatori dello sviluppo mondiale
La fonte (organizzazione):
International Monetary Fund, Government Finance Statistics Yearbook and data files.
Categorie:
Public Sector
sono stati aggiornati
23 apr 2017 anni
Indicatori delle variazioni dei valori per anni
In media:
0.139
Minima:
0.029
1 gen 1997 anni
Massimo:
0.385
1 gen 2002 anni
Alla data di osservazione
Valore
Variazione assoluta
La variazione rispetto al valore precedente
1 gen 1991 anni
0.086
+0.086
0.0%
1 gen 1992 anni
0.061
-0.024
-28.49%
1 gen 1993 anni
0.044
-0.018
-28.93%
1 gen 1994 anni
0.05
+0.007
15.07%
1 gen 1995 anni
0.035
-0.015
-30.55%
1 gen 1996 anni
0.032
-0.003
-8.85%
1 gen 1997 anni
0.029
-0.003
-10.36%
1 gen 1998 anni
0.041
+0.012
43.46%
1 gen 1999 anni
0.07
+0.03
72.37%
1 gen 2000 anni
0.062
-0.008
-12.02%
1 gen 2001 anni
0.05
-0.012
-19.14%
1 gen 2002 anni
0.385
+0.335
667.08%
1 gen 2003 anni
0.234
-0.15
-39.05%
1 gen 2004 anni
0.141
-0.094
-39.96%
1 gen 2005 anni
0.236
+0.095
67.71%
1 gen 2006 anni
0.182
-0.054
-22.81%
1 gen 2007 anni
0.144
-0.038
-20.74%
1 gen 2008 anni
0.11
-0.035
-24.04%
1 gen 2009 anni
0.23
+0.12
109.43%
1 gen 2010 anni
0.29
+0.06
26.0%
1 gen 2011 anni
0.255
-0.035
-11.97%
1 gen 2012 anni
0.149
-0.106
-41.57%
1 gen 2013 anni
0.24
+0.092
61.49%
1 gen 2014 anni
0.19
-0.05
-20.93%
Classificazione dei paesi secondo i statistiche attuali per anni

Commenti:

Inviare
PremiumAbout & FeedbackAccordoPrivatezza
logo
© 2022 Selected Technologies LLC – Morgan Hill, California