29
/it/
it
AIzaSyAYiBZKx7MnpbEhh9jyipgxe19OcubqV5w
April 1, 2024
194946
Mauritius
MUS
true
2
1
Social contributions (% of revenue)
2015,2014,2013,2012,2011,2010,2009,2008,2007,2006,2005,2004,2003,2002,2001,2000,1999,1998,1997,1996,1995,1994,1993,1992,1991
Download
Biblioteca di statistiche globali →Mauritius →

Social contributions (% of revenue)

Queste statistiche in altri paesi:
AfghanistanAlbaniaAngolaArgentinaArmeniaAustraliaAustriaAzerbaijanBarbadosBelarusBelgiumBelizeBeninBhutanBoliviaBosnia and HerzegovinaBrazilBulgariaBurundiCabo VerdeCanadaCaribbean small statesCentral African RepublicCentral Europe and the BalticsChileChinaColombiaCongo, Rep.Costa RicaCote d'IvoireCroatiaCyprusCzech RepublicDenmarkDominican RepublicEgypt, Arab Rep.El SalvadorEstoniaEthiopiaEuro areaEurope & Central AsiaEurope & Central Asia (excluding high income)Europe & Central Asia (IDA & IBRD countries)European UnionFijiFinlandFranceGambia, TheGeorgiaGermanyGhanaGreeceGuatemalaHigh incomeHondurasHong Kong SAR, ChinaHungaryIBRD onlyIcelandIDA blendIndiaIndonesiaIran, Islamic Rep.IraqIrelandIsraelItalyJamaicaJapanJordanKazakhstanKenyaKorea, Rep.Late-demographic dividendLatin America & Caribbean Latin America & Caribbean (excluding high income)Latin America & the Caribbean (IDA & IBRD countries)LatviaLebanonLiberiaLithuaniaLuxembourgMacao SAR, ChinaMacedonia, FYRMadagascarMaltaMauritiusMexicoMoldovaMongoliaMoroccoMozambiqueNamibiaNetherlandsNew ZealandNorth AmericaNorwayOECD membersPanamaPapua New GuineaParaguayPeruPolandPortugalPost-demographic dividendRomaniaRussian FederationSan MarinoSao Tome and PrincipeSerbiaSeychellesSlovak RepublicSloveniaSmall statesSouth AfricaSouth AsiaSouth Asia (IDA & IBRD)SpainSri LankaSt. Kitts and NevisSwedenSwitzerlandSyrian Arab RepublicTajikistanThailandTrinidad and TobagoTunisiaTurkeyUkraineUnited Arab EmiratesUnited KingdomUnited StatesUpper middle incomeUruguayVenezuela, RBZambiaZimbabwe
Linea del tempo:
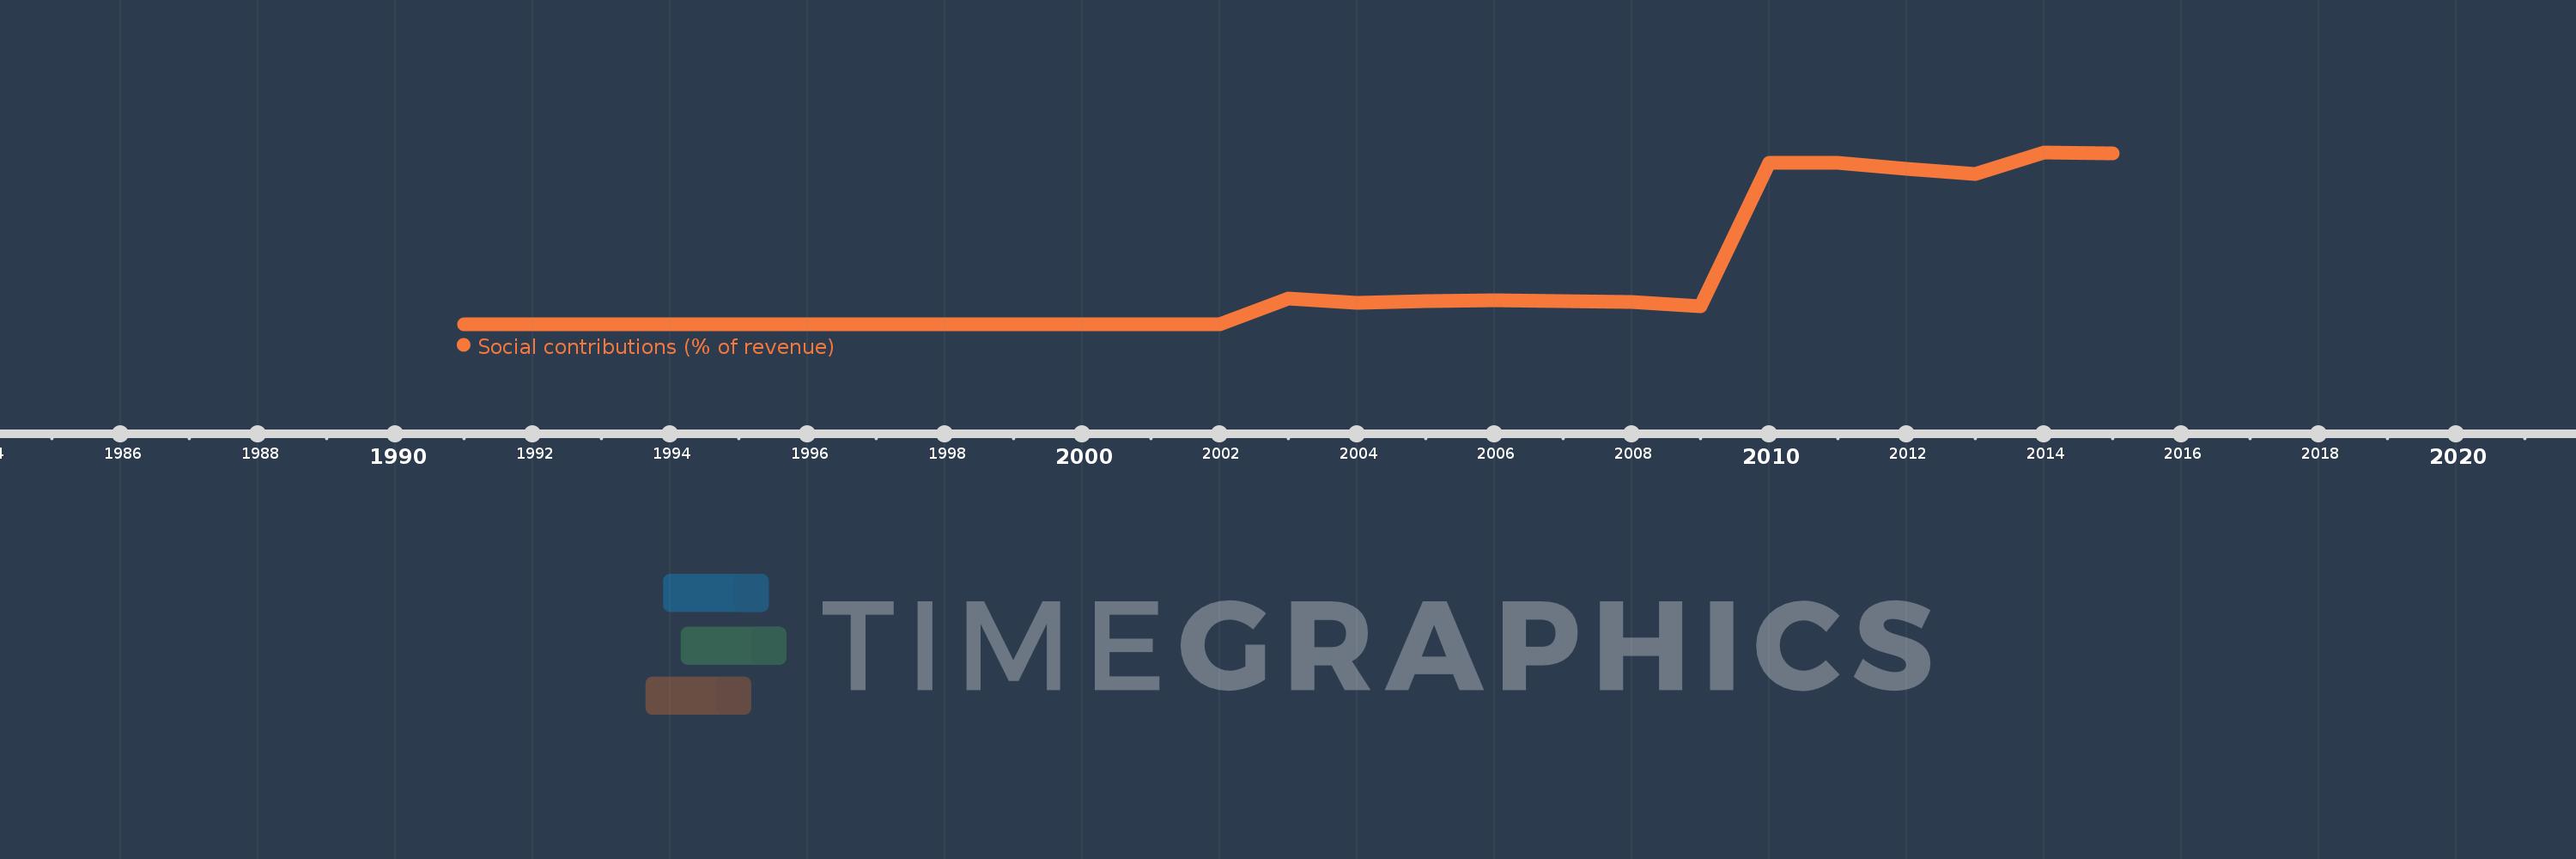
Questa scala temporale mostra un grafico dal 1991 anno al 2015 anno. Mauritius. I dati fino ad 1990 anno non disponibili. Il numero di osservazioni attuali secondo i date: 25.
La fonte (nome):
Indicatori dello sviluppo mondiale
La fonte (organizzazione):
International Monetary Fund, Government Finance Statistics Yearbook and data files.
Categorie:
Public Sector
sono stati aggiornati
23 apr 2017 anni
Indicatori delle variazioni dei valori per anni
In media:
0.925
Minima:
0.004
1 gen 1992 anni
Massimo:
3.507
1 gen 2014 anni
Alla data di osservazione
Valore
Variazione assoluta
La variazione rispetto al valore precedente
1 gen 1991 anni
0.005
+0.005
0.0%
1 gen 1992 anni
0.004
-0.001
-11.75%
1 gen 1993 anni
0.005
+0.001
13.65%
1 gen 1994 anni
0.004
0.0
-7.09%
1 gen 1995 anni
0.005
+0.001
22.85%
1 gen 1996 anni
0.005
0.0
-1.17%
1 gen 1997 anni
0.006
+0.0
2.32%
1 gen 1998 anni
0.005
-0.001
-11.05%
1 gen 1999 anni
0.005
+0.001
11.27%
1 gen 2000 anni
0.005
-0.001
-11.19%
1 gen 2001 anni
0.004
0.0
-9.75%
1 gen 2002 anni
0.009
+0.004
102.47%
1 gen 2003 anni
0.52
+0.511
5.79 Mille.%
1 gen 2004 anni
0.448
-0.072
-13.85%
1 gen 2005 anni
0.482
+0.034
7.54%
1 gen 2006 anni
0.492
+0.01
2.11%
1 gen 2007 anni
0.476
-0.016
-3.2%
1 gen 2008 anni
0.454
-0.023
-4.77%
1 gen 2009 anni
0.37
-0.084
-18.51%
1 gen 2010 anni
3.294
+2.924
790.91%
1 gen 2011 anni
3.3
+0.006
0.19%
1 gen 2012 anni
3.166
-0.135
-4.09%
1 gen 2013 anni
3.07
-0.095
-3.0%
1 gen 2014 anni
3.507
+0.437
14.23%
1 gen 2015 anni
3.492
-0.016
-0.44%
Classificazione dei paesi secondo i statistiche attuali per anni

Commenti:

Inviare
PremiumAbout & FeedbackAccordoPrivatezza
logo
© 2022 Selected Technologies LLC – Morgan Hill, California