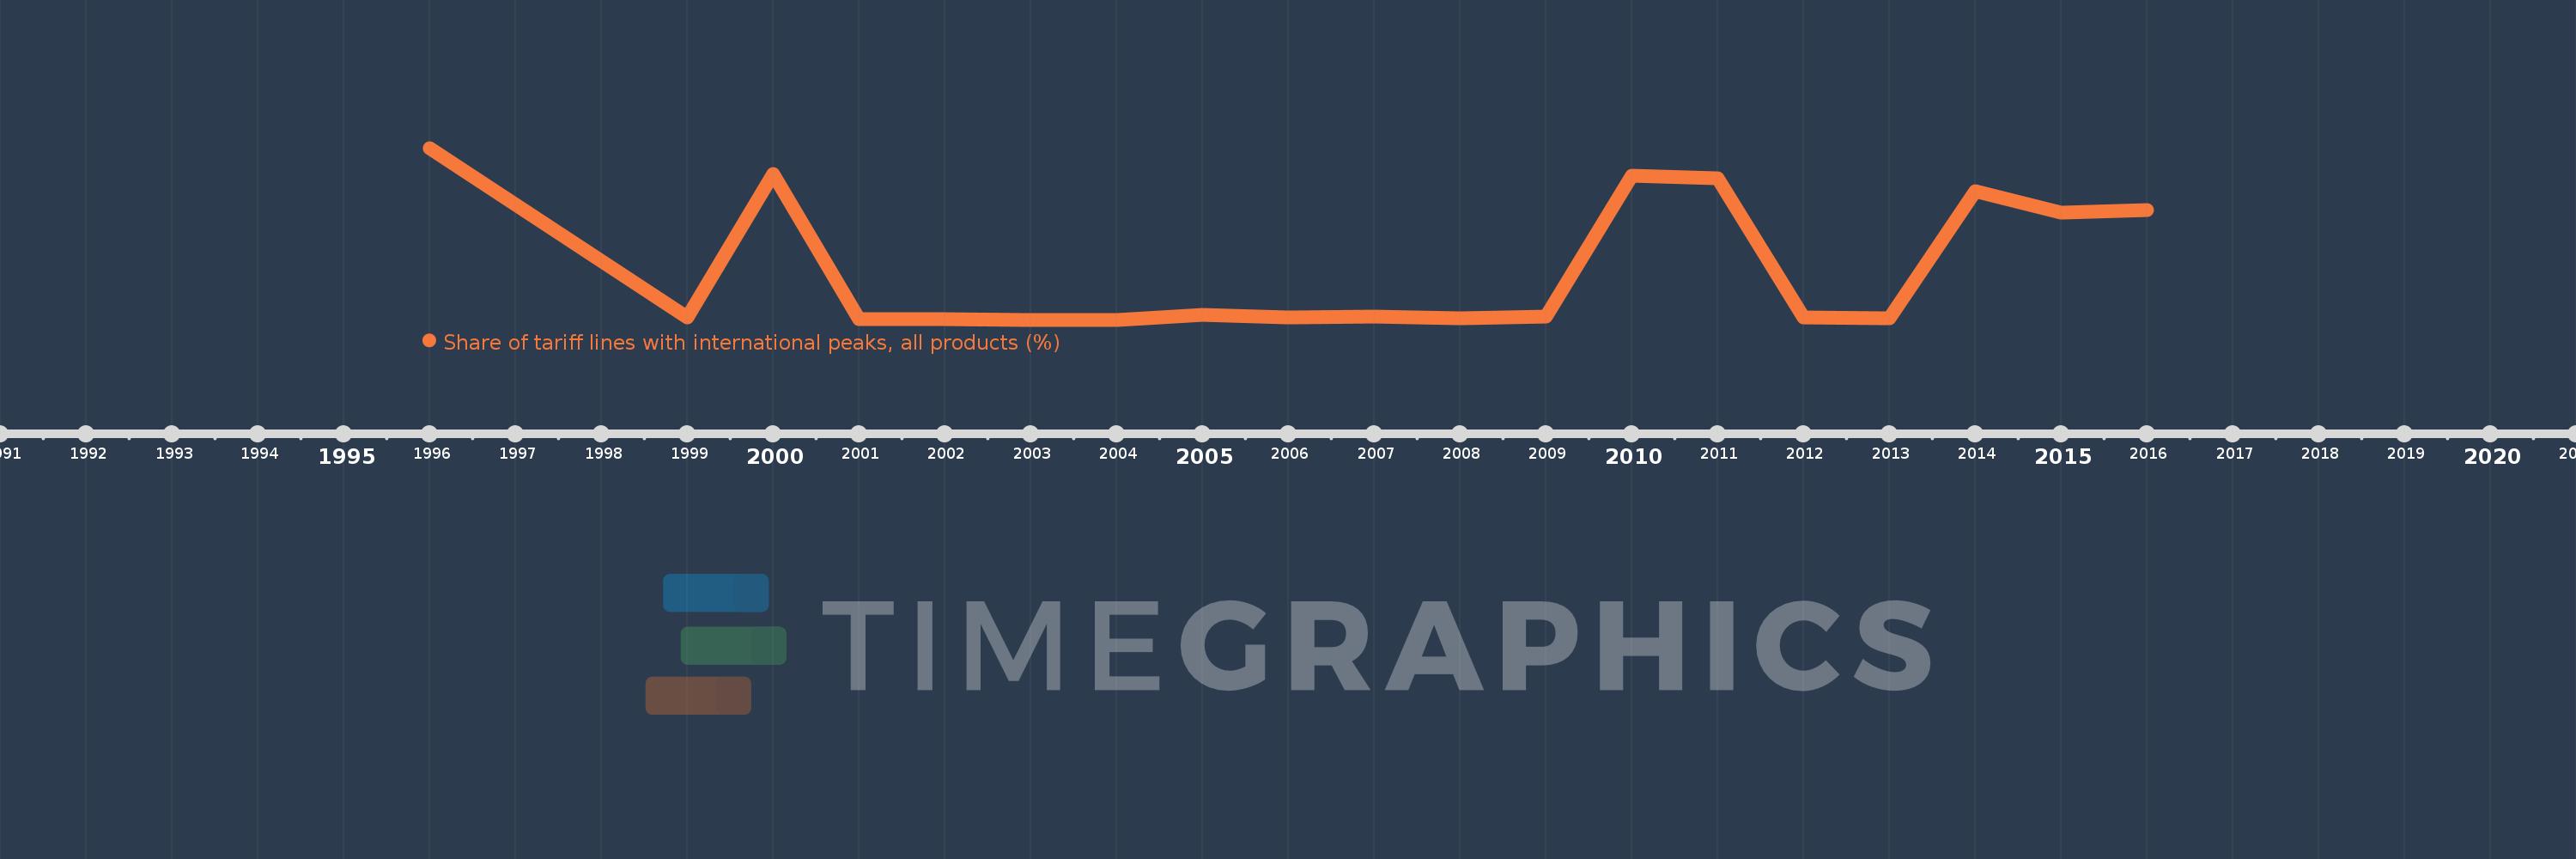
Questa scala temporale mostra un grafico dal 1996 anno al 2016 anno. Nicaragua. I dati fino ad 1995 anno non disponibili. Il numero di osservazioni attuali secondo i date: 19.
La fonte (nome):
Indicatori dello sviluppo mondiale
La fonte (organizzazione):
World Bank staff estimates using the World Integrated Trade Solution system, based on data from United Nations Conference on Trade and Development's Trade Analysis and Information System (TRAINS) database.
Categorie:
Private Sector, Trade
sono stati aggiornati
23 apr 2017 anni
Indicatori delle variazioni dei valori per anni
In media:
6.268
Minima:
0.17
1 gen 2003 anni
Massimo:
20.667
1 gen 1996 anni
Alla data di osservazione
Valore
Variazione assoluta
La variazione rispetto al valore precedente
1 gen 1996 anni
20.667
+20.667
0.0%
1 gen 1999 anni
0.431
-20.236
-97.91%
1 gen 2000 anni
17.604
+17.173
3.99 Mille.%
1 gen 2001 anni
0.277
-17.327
-98.43%
1 gen 2002 anni
0.213
-0.063
-22.9%
1 gen 2003 anni
0.17
-0.044
-20.46%
1 gen 2004 anni
0.182
+0.012
6.91%
1 gen 2005 anni
0.758
+0.576
317.32%
1 gen 2006 anni
0.482
-0.275
-36.33%
1 gen 2007 anni
0.505
+0.022
4.63%
1 gen 2008 anni
0.373
-0.131
-26.01%
1 gen 2009 anni
0.521
+0.147
39.46%
1 gen 2010 anni
17.345
+16.824
3.23 Mille.%
1 gen 2011 anni
17.1
-0.245
-1.41%
1 gen 2012 anni
0.405
-16.696
-97.63%
1 gen 2013 anni
0.343
-0.061
-15.18%
1 gen 2014 anni
15.508
+15.164
4.42 Mille.%
1 gen 2015 anni
12.935
-2.573
-16.59%
1 gen 2016 anni
13.273
+0.338
2.61%
Classificazione dei paesi secondo i statistiche attuali per anni