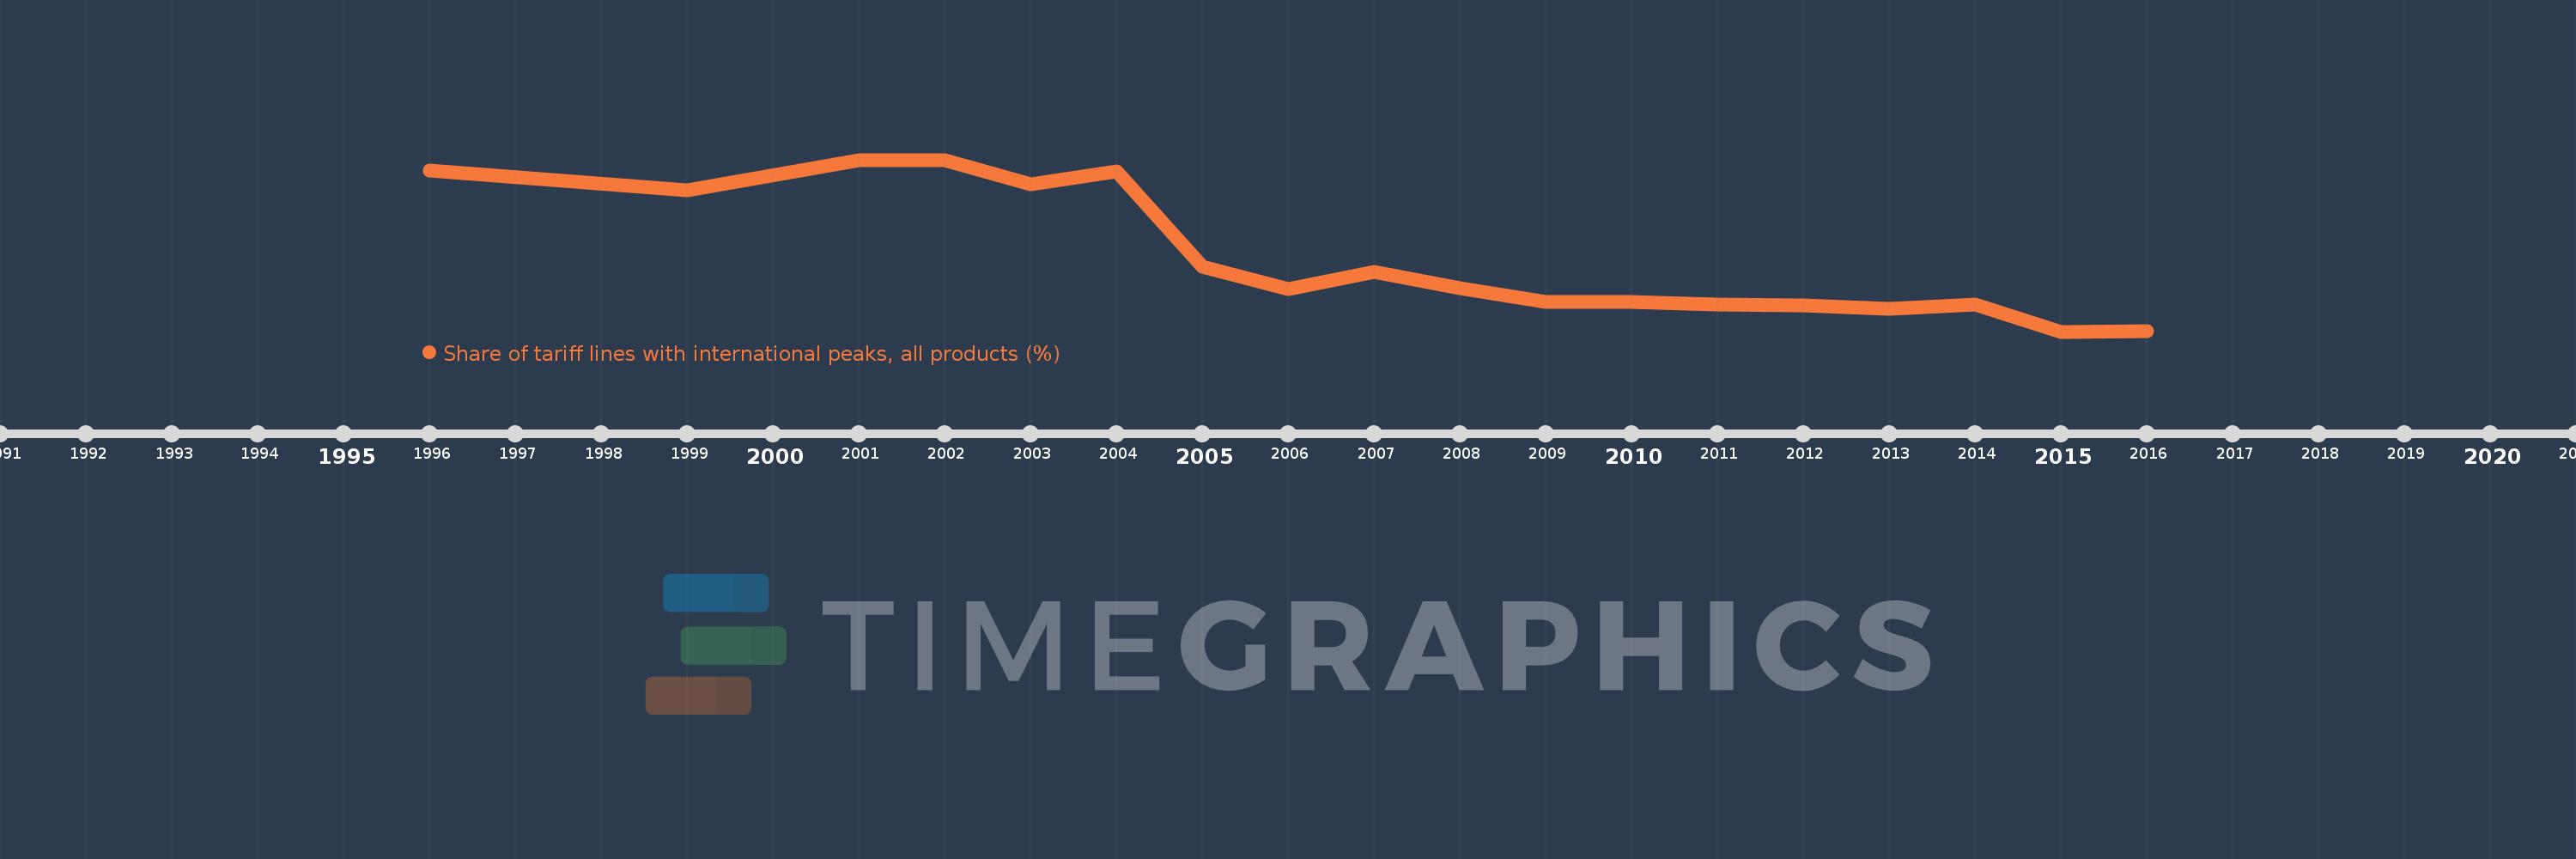
Questa scala temporale mostra un grafico dal 1996 anno al 2016 anno. Egypt, Arab Rep.. I dati fino ad 1995 anno non disponibili. Il numero di osservazioni attuali secondo i date: 18.
La fonte (nome):
Indicatori dello sviluppo mondiale
La fonte (organizzazione):
World Bank staff estimates using the World Integrated Trade Solution system, based on data from United Nations Conference on Trade and Development's Trade Analysis and Information System (TRAINS) database.
Categorie:
Private Sector, Trade
sono stati aggiornati
23 apr 2017 anni
Indicatori delle variazioni dei valori per anni
In media:
29.854
Minima:
10.394
1 gen 2015 anni
Massimo:
55.744
1 gen 2002 anni
Alla data di osservazione
Valore
Variazione assoluta
La variazione rispetto al valore precedente
1 gen 1996 anni
53.008
+53.008
0.0%
1 gen 1999 anni
47.597
-5.411
-10.21%
1 gen 2001 anni
55.687
+8.09
17.0%
1 gen 2002 anni
55.744
+0.057
0.1%
1 gen 2003 anni
49.346
-6.398
-11.48%
1 gen 2004 anni
52.651
+3.305
6.7%
1 gen 2005 anni
27.62
-25.031
-47.54%
1 gen 2006 anni
21.675
-5.945
-21.52%
1 gen 2007 anni
26.06
+4.385
20.23%
1 gen 2008 anni
21.813
-4.248
-16.3%
1 gen 2009 anni
18.104
-3.708
-17.0%
1 gen 2010 anni
18.294
+0.19
1.05%
1 gen 2011 anni
17.586
-0.708
-3.87%
1 gen 2012 anni
17.232
-0.355
-2.02%
1 gen 2013 anni
16.407
-0.824
-4.78%
1 gen 2014 anni
17.551
+1.143
6.97%
1 gen 2015 anni
10.394
-7.156
-40.77%
1 gen 2016 anni
10.602
+0.208
2.0%
Classificazione dei paesi secondo i statistiche attuali per anni