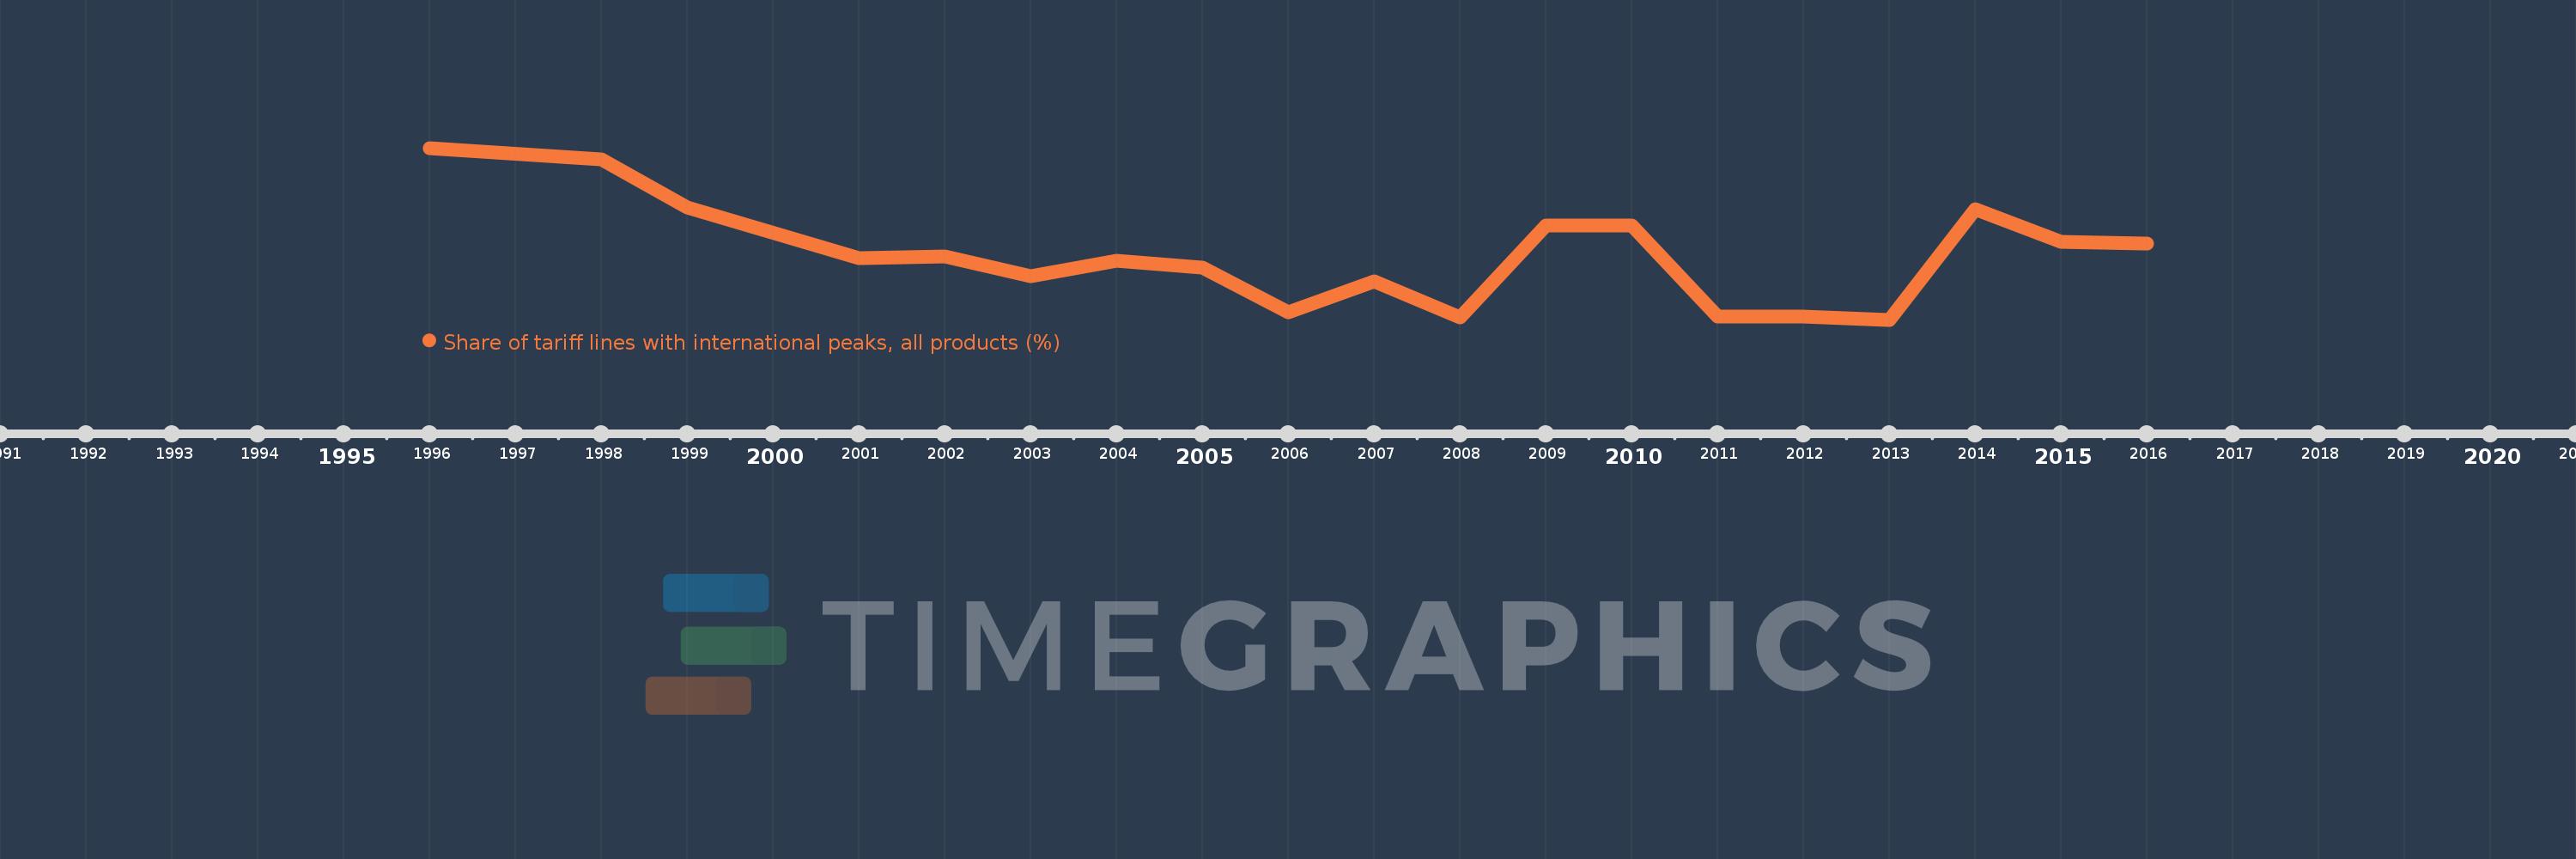
Questa scala temporale mostra un grafico dal 1996 anno al 2016 anno. El Salvador. I dati fino ad 1995 anno non disponibili. Il numero di osservazioni attuali secondo i date: 19.
La fonte (nome):
Indicatori dello sviluppo mondiale
La fonte (organizzazione):
World Bank staff estimates using the World Integrated Trade Solution system, based on data from United Nations Conference on Trade and Development's Trade Analysis and Information System (TRAINS) database.
Categorie:
Private Sector, Trade
sono stati aggiornati
23 apr 2017 anni
Indicatori delle variazioni dei valori per anni
In media:
10.782
Minima:
1.229
1 gen 2013 anni
Massimo:
26.549
1 gen 1996 anni
Alla data di osservazione
Valore
Variazione assoluta
La variazione rispetto al valore precedente
1 gen 1996 anni
26.549
+26.549
0.0%
1 gen 1998 anni
24.818
-1.731
-6.52%
1 gen 1999 anni
17.714
-7.104
-28.63%
1 gen 2001 anni
10.348
-7.366
-41.58%
1 gen 2002 anni
10.609
+0.261
2.52%
1 gen 2003 anni
7.59
-3.019
-28.46%
1 gen 2004 anni
9.891
+2.301
30.32%
1 gen 2005 anni
8.891
-1.0
-10.11%
1 gen 2006 anni
2.28
-6.611
-74.35%
1 gen 2007 anni
6.93
+4.65
203.92%
1 gen 2008 anni
1.569
-5.361
-77.36%
1 gen 2009 anni
15.15
+13.581
865.74%
1 gen 2010 anni
15.069
-0.081
-0.54%
1 gen 2011 anni
1.755
-13.314
-88.35%
1 gen 2012 anni
1.731
-0.024
-1.37%
1 gen 2013 anni
1.229
-0.502
-29.0%
1 gen 2014 anni
17.549
+16.32
1.33 Mille.%
1 gen 2015 anni
12.767
-4.782
-27.25%
1 gen 2016 anni
12.417
-0.35
-2.74%
Classificazione dei paesi secondo i statistiche attuali per anni