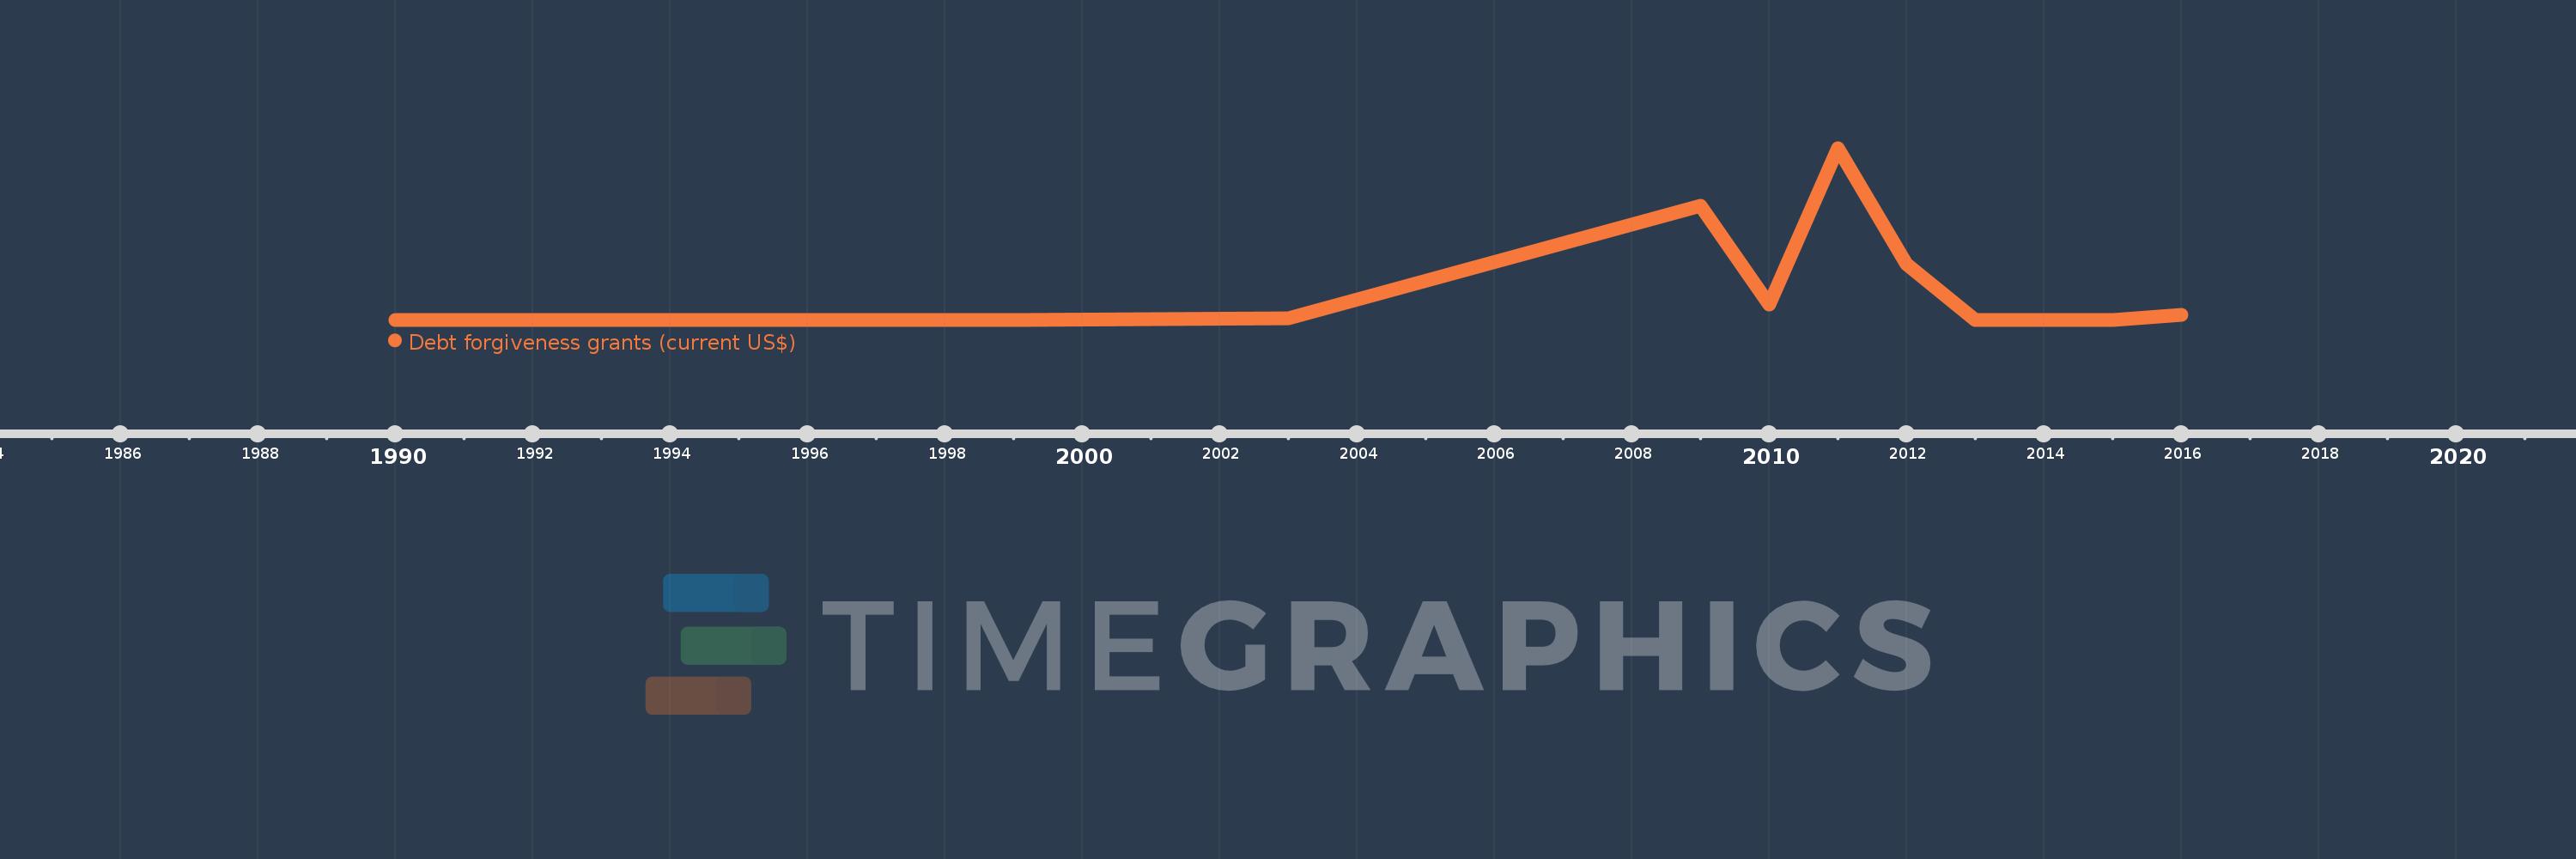
Questa scala temporale mostra un grafico dal 1990 anno al 2016 anno. Liberia. I dati fino ad 1989 anno non disponibili. Il numero di osservazioni attuali secondo i date: 18.
La fonte (nome):
Indicatori dello sviluppo mondiale
La fonte (organizzazione):
Development Assistance Committee of the Organisation for Economic Co-operation and Development.
Categorie:
Aid Effectiveness, External Debt
sono stati aggiornati
23 apr 2017 anni
Indicatori delle variazioni dei valori per anni
In media:
141.072 Mln
Minima:
170.0 Mille.
1 gen 2013 anni
Massimo:
1.199 Mlrd
1 gen 2011 anni
Alla data di osservazione
Valore
Variazione assoluta
La variazione rispetto al valore precedente
1 gen 1990 anni
720.0 Mille.
+720.0 Mille.
0.0%
1 gen 1991 anni
840.0 Mille.
+120.0 Mille.
16.67%
1 gen 1992 anni
820.0 Mille.
-20.0 Mille.
-2.38%
1 gen 1993 anni
870.0 Mille.
+50.0 Mille.
6.1%
1 gen 1994 anni
750.0 Mille.
-120.0 Mille.
-13.79%
1 gen 1995 anni
560.0 Mille.
-190.0 Mille.
-25.33%
1 gen 1996 anni
550.0 Mille.
-10.0 Mille.
-1.79%
1 gen 1997 anni
530.0 Mille.
-20.0 Mille.
-3.64%
1 gen 1999 anni
470.0 Mille.
-60.0 Mille.
-11.32%
1 gen 2003 anni
9.93 Mln
+9.46 Mln
2.01 Mille.%
1 gen 2009 anni
794.88 Mln
+784.95 Mln
7.9 Mille.%
1 gen 2010 anni
106.08 Mln
-688.8 Mln
-86.65%
1 gen 2011 anni
1.199 Mlrd
+1.093 Mlrd
1.03 Mille.%
1 gen 2012 anni
386.1 Mln
-813.27 Mln
-67.81%
1 gen 2013 anni
170.0 Mille.
-385.93 Mln
-99.96%
1 gen 2014 anni
170.0 Mille.
0.0
0.0%
1 gen 2015 anni
170.0 Mille.
0.0
0.0%
1 gen 2016 anni
36.31 Mln
+36.14 Mln
21.26 Mille.%
Classificazione dei paesi secondo i statistiche attuali per anni