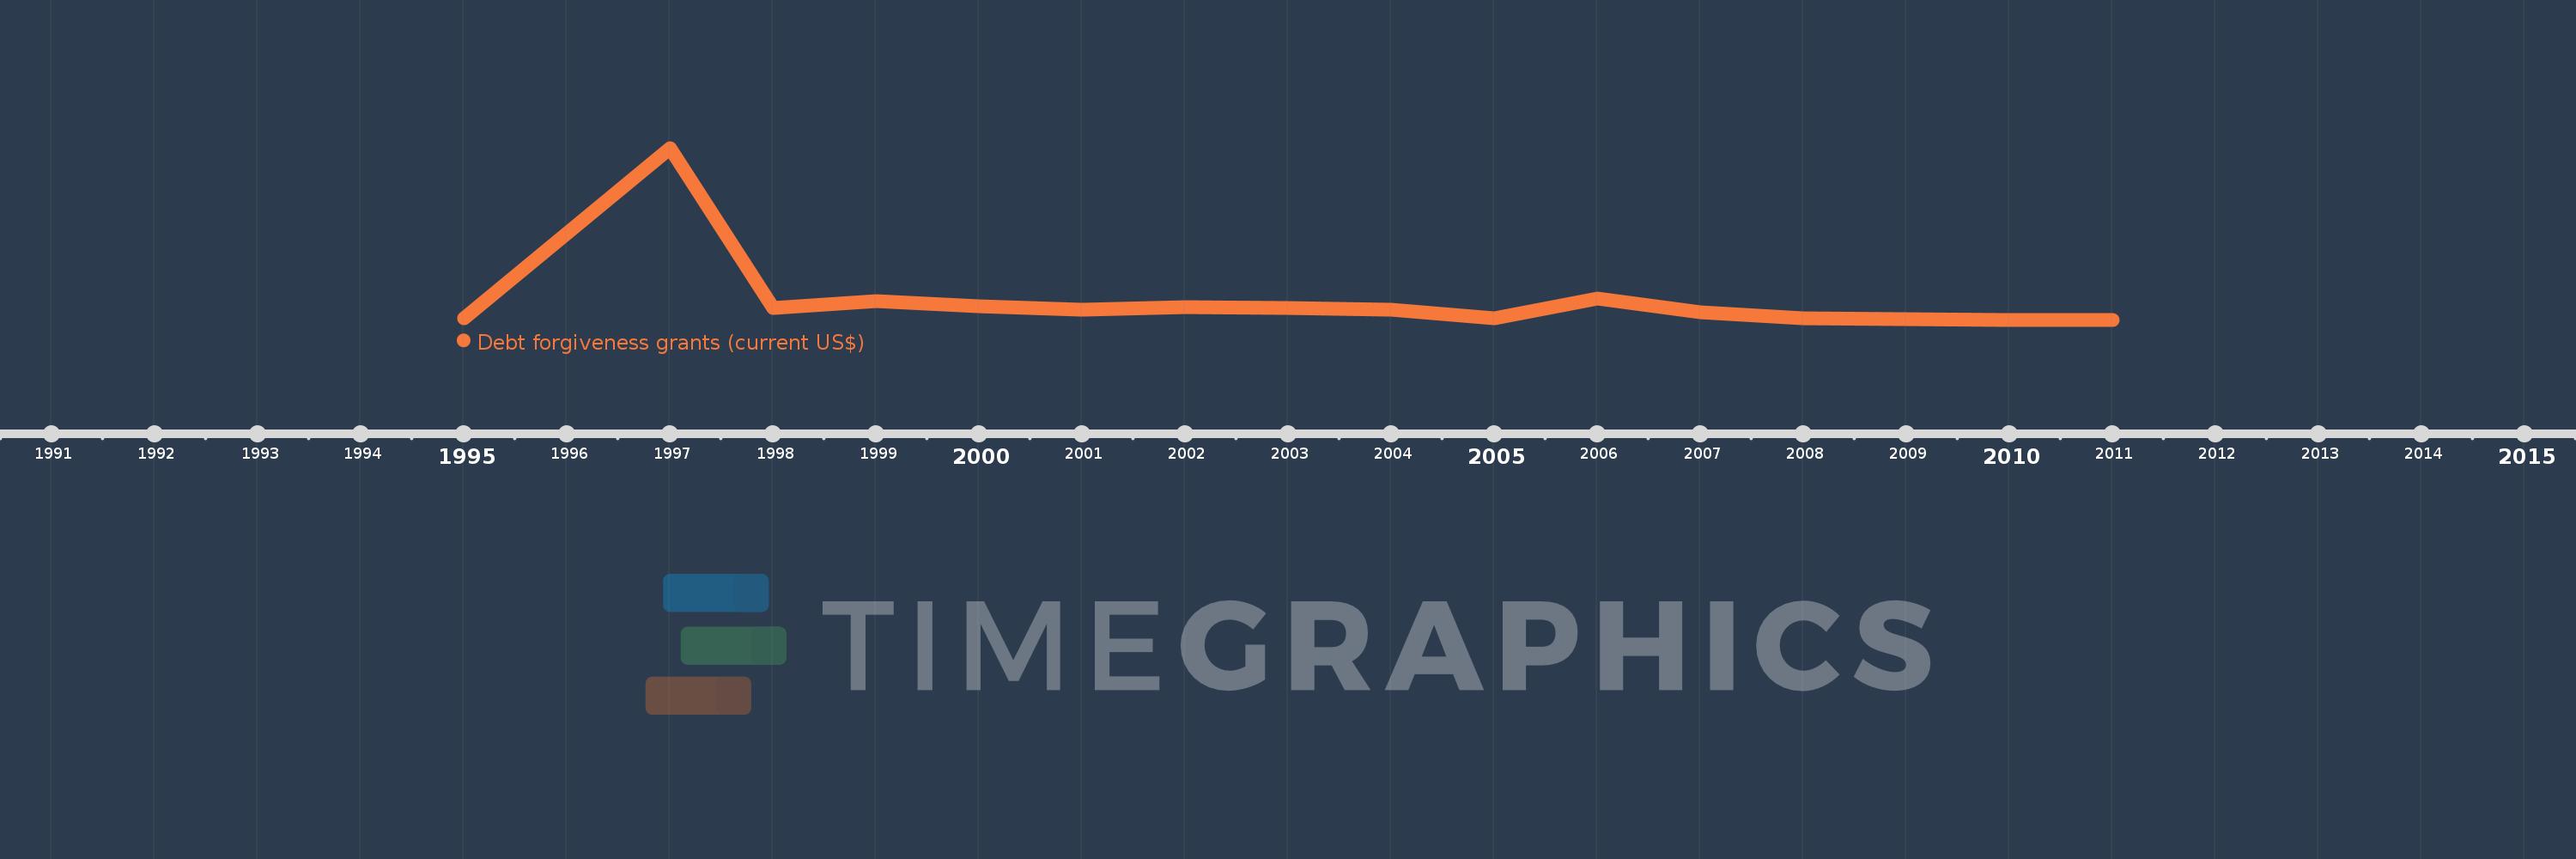
Questa scala temporale mostra un grafico dal 1995 anno al 2011 anno. Lao PDR. I dati fino ad 1994 anno non disponibili. Il numero di osservazioni attuali secondo i date: 16.
La fonte (nome):
Indicatori dello sviluppo mondiale
La fonte (organizzazione):
Development Assistance Committee of the Organisation for Economic Co-operation and Development.
Categorie:
Aid Effectiveness, External Debt
sono stati aggiornati
23 apr 2017 anni
Indicatori delle variazioni dei valori per anni
In media:
3.773 Mln
Minima:
10.0 Mille.
1 gen 2011 anni
Massimo:
35.14 Mln
1 gen 1997 anni
Alla data di osservazione
Valore
Variazione assoluta
La variazione rispetto al valore precedente
1 gen 1995 anni
300.0 Mille.
+300.0 Mille.
0.0%
1 gen 1997 anni
35.14 Mln
+34.84 Mln
11.61 Mille.%
1 gen 1998 anni
2.47 Mln
-32.67 Mln
-92.97%
1 gen 1999 anni
3.74 Mln
+1.27 Mln
51.42%
1 gen 2000 anni
2.81 Mln
-930.0 Mille.
-24.87%
1 gen 2001 anni
2.08 Mln
-730.0 Mille.
-25.98%
1 gen 2002 anni
2.52 Mln
+440.0 Mille.
21.15%
1 gen 2003 anni
2.42 Mln
-100.0 Mille.
-3.97%
1 gen 2004 anni
2.15 Mln
-270.0 Mille.
-11.16%
1 gen 2005 anni
320.0 Mille.
-1.83 Mln
-85.12%
1 gen 2006 anni
4.35 Mln
+4.03 Mln
1.26 Mille.%
1 gen 2007 anni
1.61 Mln
-2.74 Mln
-62.99%
1 gen 2008 anni
350.0 Mille.
-1.26 Mln
-78.26%
1 gen 2009 anni
70.0 Mille.
-280.0 Mille.
-80.0%
1 gen 2010 anni
30.0 Mille.
-40.0 Mille.
-57.14%
1 gen 2011 anni
10.0 Mille.
-20.0 Mille.
-66.67%
Classificazione dei paesi secondo i statistiche attuali per anni