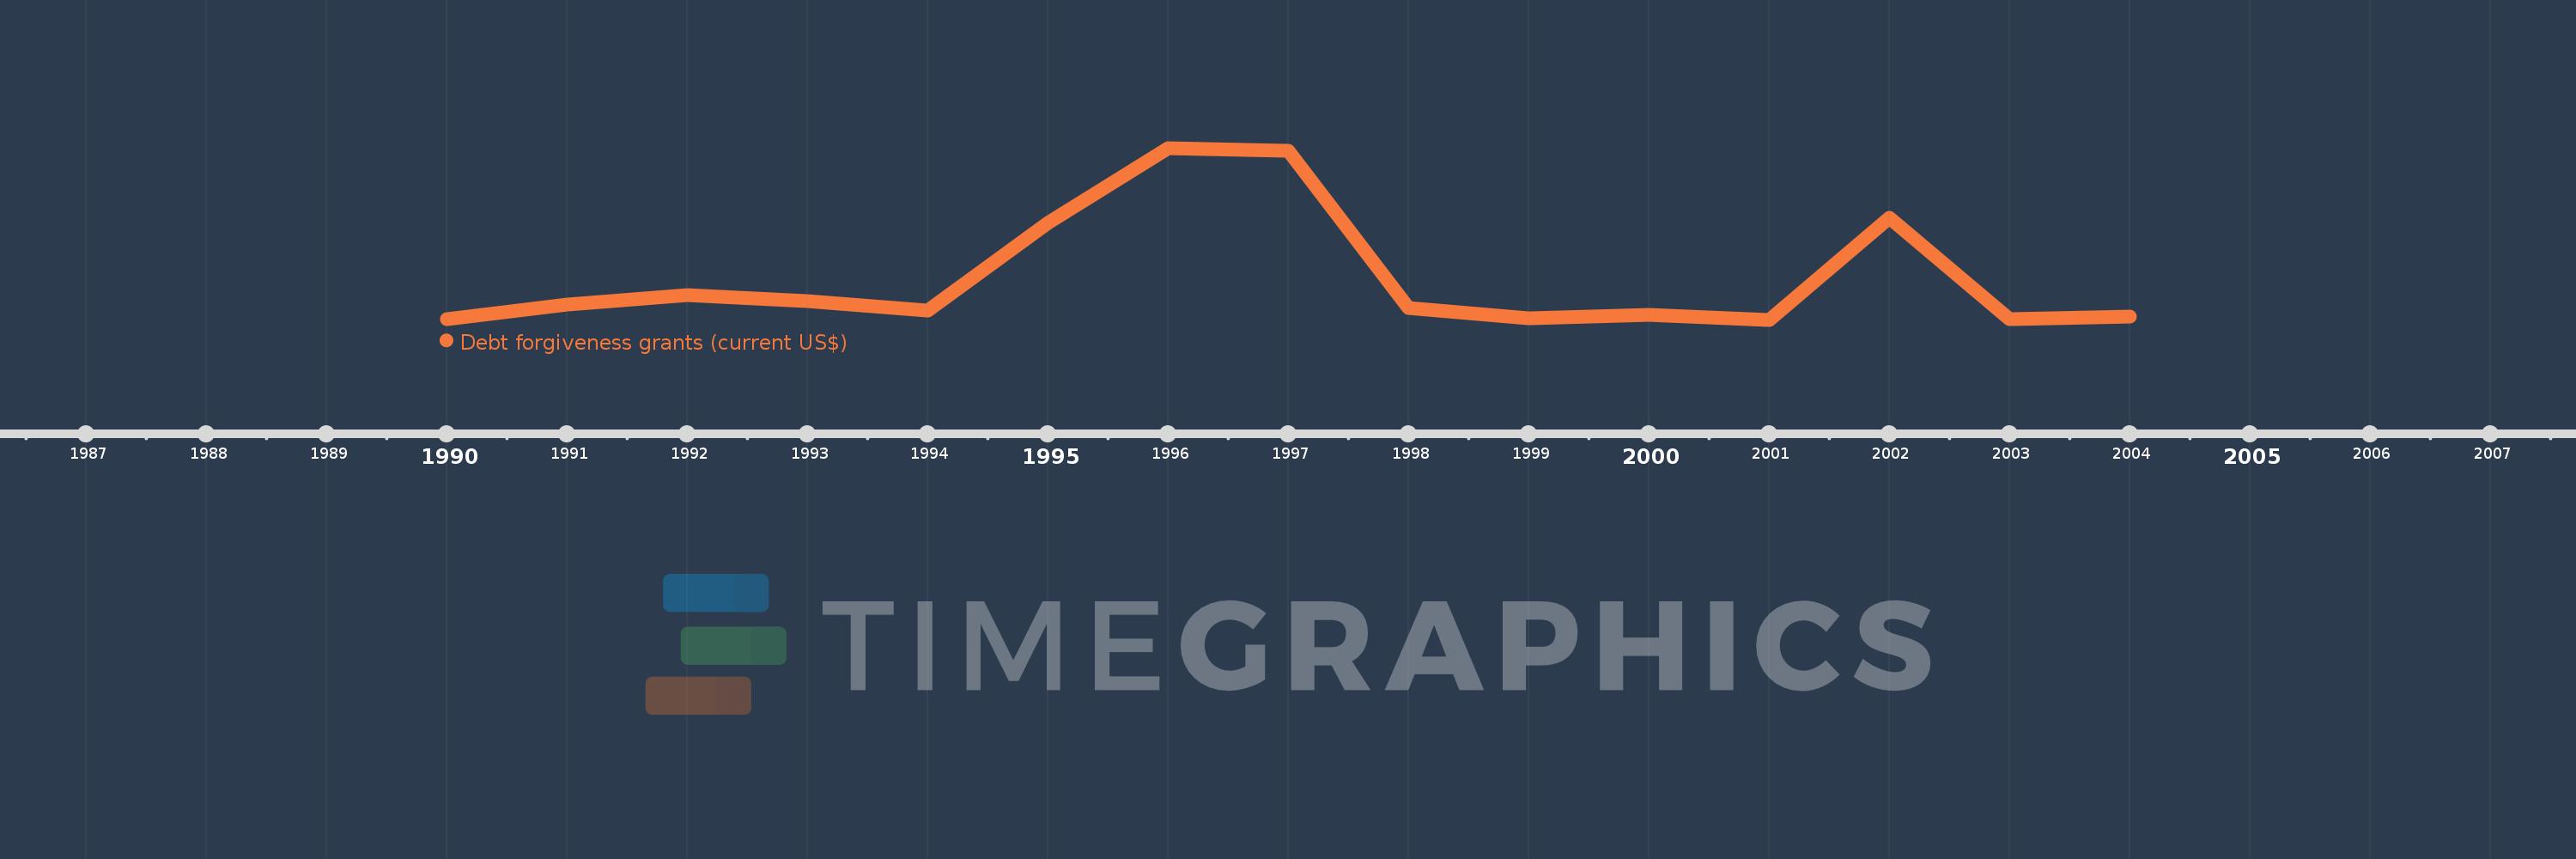
Questa scala temporale mostra un grafico dal 1990 anno al 2004 anno. India. I dati fino ad 1989 anno non disponibili. Il numero di osservazioni attuali secondo i date: 15.
La fonte (nome):
Indicatori dello sviluppo mondiale
La fonte (organizzazione):
Development Assistance Committee of the Organisation for Economic Co-operation and Development.
Categorie:
Aid Effectiveness, External Debt
sono stati aggiornati
23 apr 2017 anni
Indicatori delle variazioni dei valori per anni
In media:
12.453 Mln
Minima:
890.0 Mille.
1 gen 2001 anni
Massimo:
48.2 Mln
1 gen 1996 anni
Alla data di osservazione
Valore
Variazione assoluta
La variazione rispetto al valore precedente
1 gen 1990 anni
1.11 Mln
+1.11 Mln
0.0%
1 gen 1991 anni
5.06 Mln
+3.95 Mln
355.86%
1 gen 1992 anni
7.59 Mln
+2.53 Mln
50.0%
1 gen 1993 anni
6.06 Mln
-1.53 Mln
-20.16%
1 gen 1994 anni
3.43 Mln
-2.63 Mln
-43.4%
1 gen 1995 anni
27.55 Mln
+24.12 Mln
703.21%
1 gen 1996 anni
48.2 Mln
+20.65 Mln
74.95%
1 gen 1997 anni
47.44 Mln
-760.0 Mille.
-1.58%
1 gen 1998 anni
4.03 Mln
-43.41 Mln
-91.51%
1 gen 1999 anni
1.34 Mln
-2.69 Mln
-66.75%
1 gen 2000 anni
2.27 Mln
+930.0 Mille.
69.4%
1 gen 2001 anni
890.0 Mille.
-1.38 Mln
-60.79%
1 gen 2002 anni
28.88 Mln
+27.99 Mln
3.14 Mille.%
1 gen 2003 anni
1.08 Mln
-27.8 Mln
-96.26%
1 gen 2004 anni
1.86 Mln
+780.0 Mille.
72.22%
Classificazione dei paesi secondo i statistiche attuali per anni