29
/it/
it
AIzaSyAYiBZKx7MnpbEhh9jyipgxe19OcubqV5w
April 1, 2024
148263
Guyana
GUY
true
2
1
Net bilateral aid flows from DAC donors, Norway (current US$)
2015,2014,2013,2012,2011,2005,2001,2000,1999,1998,1993,1992,1991,1990,1989,1988,1987
Download
Biblioteca di statistiche globali →Guyana →

Net bilateral aid flows from DAC donors, Norway (current US$)

Queste statistiche in altri paesi:
AfghanistanAlbaniaAlgeriaAngolaAntigua and BarbudaArab WorldArgentinaArmeniaAzerbaijanBahrainBangladeshBarbadosBelarusBelizeBeninBermudaBhutanBoliviaBosnia and HerzegovinaBotswanaBrazilBulgariaBurkina FasoBurundiCabo VerdeCambodiaCameroonCaribbean small statesCentral African RepublicCentral Europe and the BalticsChadChileChinaColombiaComorosCongo, Dem. Rep.Congo, Rep.Costa RicaCote d'IvoireCroatiaCubaCyprusCzech RepublicDjiboutiDominican RepublicEast Asia & PacificEast Asia & Pacific (excluding high income)East Asia & Pacific (IDA & IBRD countries)EcuadorEgypt, Arab Rep.El SalvadorEquatorial GuineaEritreaEstoniaEthiopiaEuro areaEurope & Central AsiaEurope & Central Asia (excluding high income)Europe & Central Asia (IDA & IBRD countries)European UnionFijiFragile and conflict affected situationsGabonGambia, TheGeorgiaGhanaGibraltarGrenadaGuatemalaGuineaGuinea-BissauGuyanaHaitiHeavily indebted poor countries (HIPC)High incomeHondurasHong Kong SAR, ChinaHungaryIBRD onlyIDA & IBRD totalIDA blendIDA onlyIDA totalIndiaIndonesiaIran, Islamic Rep.IraqIsraelJamaicaJordanKazakhstanKenyaKiribatiKorea, Dem. People’s Rep.Korea, Rep.KosovoKuwaitKyrgyz RepublicLao PDRLatin America & Caribbean Latin America & Caribbean (excluding high income)Latin America & the Caribbean (IDA & IBRD countries)LatviaLeast developed countries: UN classificationLebanonLesothoLiberiaLibyaLithuaniaLow & middle incomeLow incomeLower middle incomeMacao SAR, ChinaMacedonia, FYRMadagascarMalawiMalaysiaMaldivesMaliMaltaMarshall IslandsMauritaniaMauritiusMexicoMiddle East & North AfricaMiddle East & North Africa (excluding high income)Middle East & North Africa (IDA & IBRD countries)Middle incomeMoldovaMongoliaMontenegroMoroccoMozambiqueMyanmarNamibiaNauruNepalNicaraguaNigerNigeriaNorth AmericaOECD membersOmanOther small statesPacific island small statesPakistanPanamaPapua New GuineaParaguayPeruPhilippinesPolandRomaniaRussian FederationRwandaSamoaSao Tome and PrincipeSaudi ArabiaSenegalSerbiaSeychellesSierra LeoneSingaporeSlovak RepublicSloveniaSmall statesSolomon IslandsSomaliaSouth AfricaSouth AsiaSouth Asia (IDA & IBRD)South SudanSri LankaSt. Kitts and NevisSt. LuciaSt. Vincent and the GrenadinesSub-Saharan Africa Sub-Saharan Africa (excluding high income)Sub-Saharan Africa (IDA & IBRD countries)SudanSurinameSwazilandSyrian Arab RepublicTajikistanTanzaniaThailandTimor-LesteTogoTongaTrinidad and TobagoTunisiaTurkeyTurkmenistanUgandaUkraineUnited Arab EmiratesUpper middle incomeUruguayUzbekistanVanuatuVenezuela, RBVietnamWest Bank and GazaWorldYemen, Rep.ZambiaZimbabwe
Linea del tempo:
Questa scala temporale mostra un grafico dal 1987 anno al 2015 anno. Guyana. I dati fino ad 1986 anno non disponibili. Il numero di osservazioni attuali secondo i date: 17.
La fonte (nome):
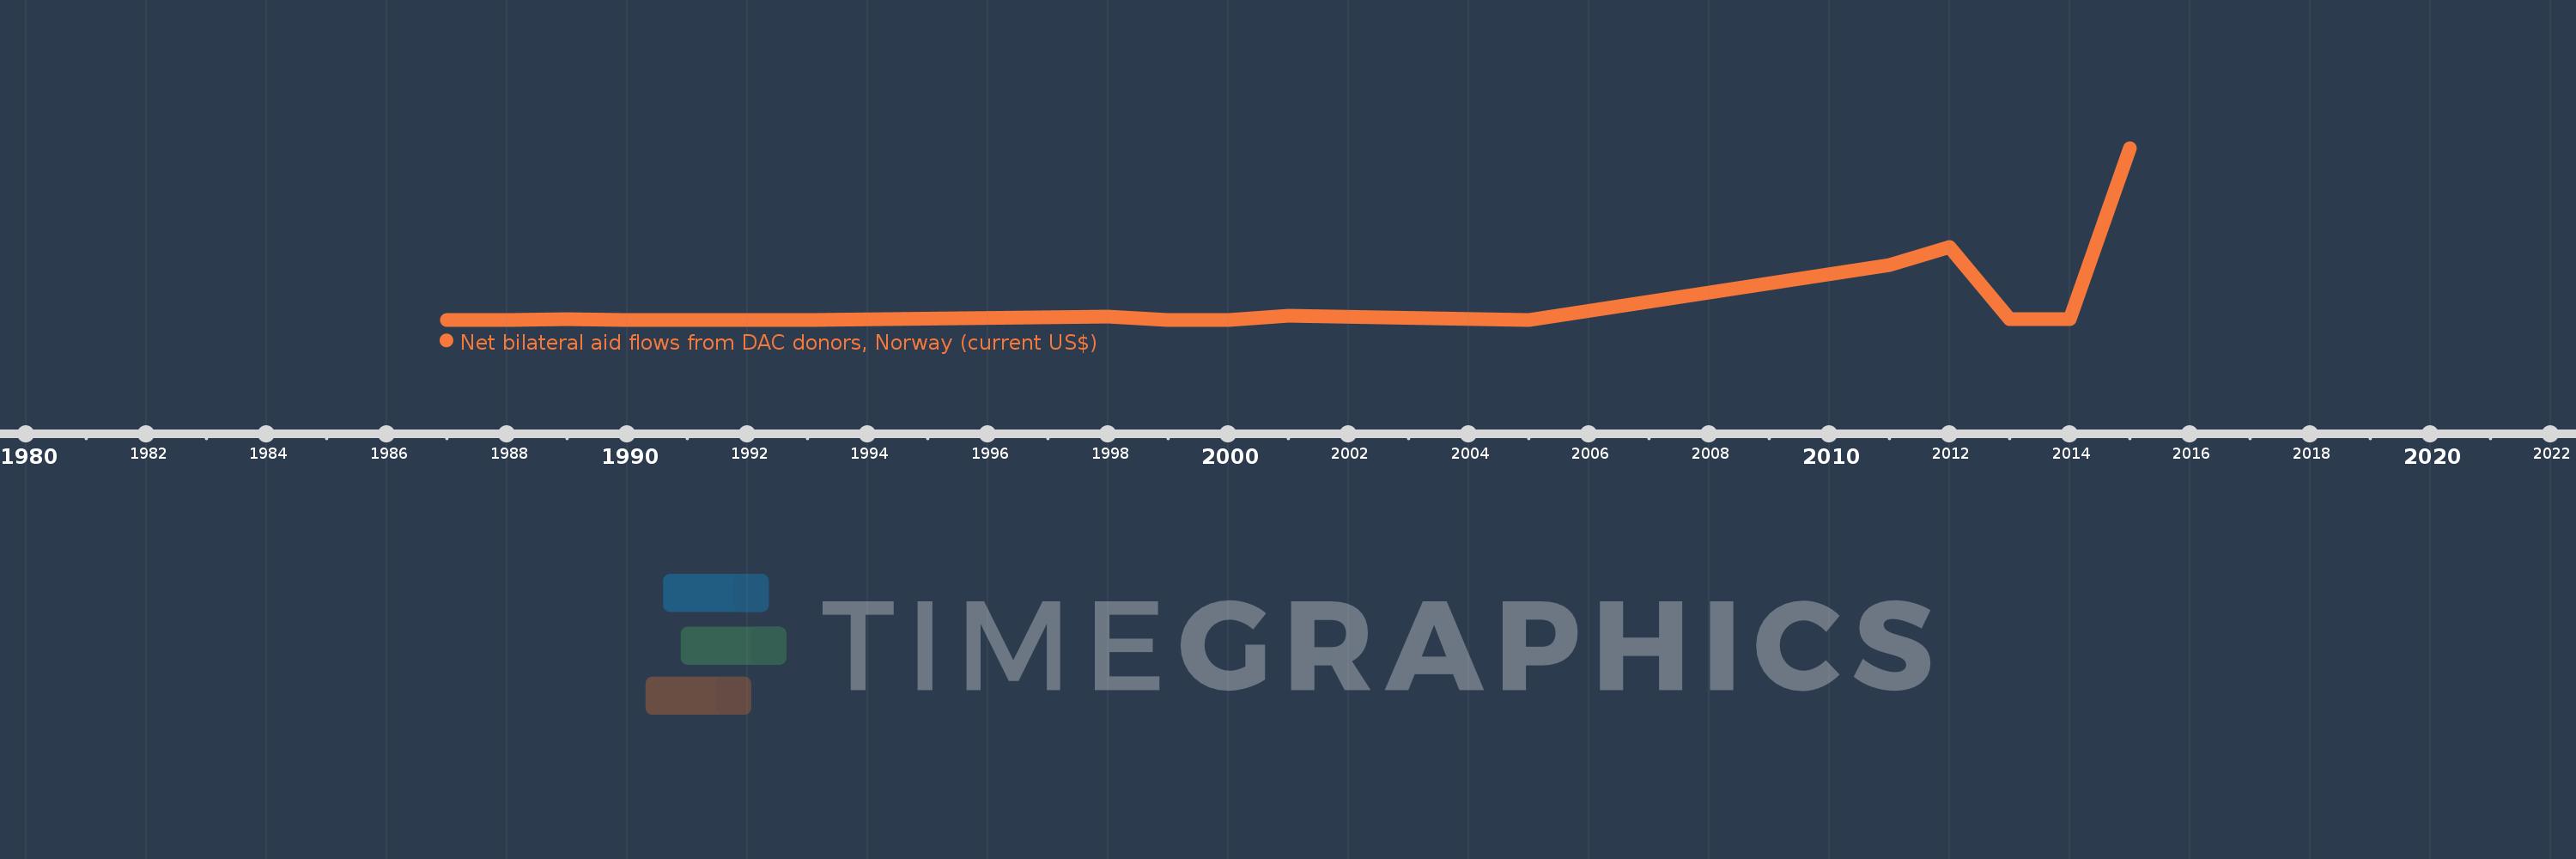
Indicatori dello sviluppo mondiale
La fonte (organizzazione):
Development Assistance Committee of the Organisation for Economic Co-operation and Development, Geographical Distribution of Financial Flows to Developing Countries, Development Co-operation Report, and International Development Statistics database. Data are available online at: www.oecd.org/dac/stats/idsonline.
Categorie:
Aid Effectiveness
sono stati aggiornati
23 apr 2017 anni
Indicatori delle variazioni dei valori per anni
In media:
9.756 Mln
Minima:
20.0 Mille.
1 gen 1987 anni
Massimo:
92.32 Mln
1 gen 2015 anni
Alla data di osservazione
Valore
Variazione assoluta
La variazione rispetto al valore precedente
1 gen 1987 anni
20.0 Mille.
+20.0 Mille.
0.0%
1 gen 1988 anni
20.0 Mille.
0.0
0.0%
1 gen 1989 anni
260.0 Mille.
+240.0 Mille.
1.2 Mille.%
1 gen 1990 anni
80.0 Mille.
-180.0 Mille.
-69.23%
1 gen 1991 anni
50.0 Mille.
-30.0 Mille.
-37.5%
1 gen 1992 anni
50.0 Mille.
0.0
0.0%
1 gen 1993 anni
60.0 Mille.
+10.0 Mille.
20.0%
1 gen 1998 anni
1.66 Mln
+1.6 Mln
2.67 Mille.%
1 gen 1999 anni
80.0 Mille.
-1.58 Mln
-95.18%
1 gen 2000 anni
70.0 Mille.
-10.0 Mille.
-12.5%
1 gen 2001 anni
2.3 Mln
+2.23 Mln
3.19 Mille.%
1 gen 2005 anni
30.0 Mille.
-2.27 Mln
-98.7%
1 gen 2011 anni
29.23 Mln
+29.2 Mln
97.33 Mille.%
1 gen 2012 anni
39.07 Mln
+9.84 Mln
33.66%
1 gen 2013 anni
390.0 Mille.
-38.68 Mln
-99.0%
1 gen 2014 anni
160.0 Mille.
-230.0 Mille.
-58.97%
1 gen 2015 anni
92.32 Mln
+92.16 Mln
57.6 Mille.%
Classificazione dei paesi secondo i statistiche attuali per anni

Commenti:

Inviare
PremiumAbout & FeedbackAccordoPrivatezza
logo
© 2022 Selected Technologies LLC – Morgan Hill, California