33
/it/
AIzaSyAYiBZKx7MnpbEhh9jyipgxe19OcubqV5w
August 1, 2025
102744
Central African Republic
CAF
true
2
1
Net bilateral aid flows from DAC donors, Norway (current US$)
2015,2014,2010,2009,2008,2007,2006,2005,2004,2001,2000,1999,1998,1997,1996,1995,1993
Download
Biblioteca di statistiche globali →Central African Republic →

Net bilateral aid flows from DAC donors, Norway (current US$)

Queste statistiche in altri paesi:

AfghanistanAlbaniaAlgeriaAngolaAntigua and BarbudaArab WorldArgentinaArmeniaAzerbaijanBahrainBangladeshBarbadosBelarusBelizeBeninBermudaBhutanBoliviaBosnia and HerzegovinaBotswanaBrazilBulgariaBurkina FasoBurundiCabo VerdeCambodiaCameroonCaribbean small statesCentral African RepublicCentral Europe and the BalticsChadChileChinaColombiaComorosCongo, Dem. Rep.Congo, Rep.Costa RicaCote d'IvoireCroatiaCubaCyprusCzech RepublicDjiboutiDominican RepublicEast Asia & PacificEast Asia & Pacific (excluding high income)East Asia & Pacific (IDA & IBRD countries)EcuadorEgypt, Arab Rep.El SalvadorEquatorial GuineaEritreaEstoniaEthiopiaEuro areaEurope & Central AsiaEurope & Central Asia (excluding high income)Europe & Central Asia (IDA & IBRD countries)European UnionFijiFragile and conflict affected situationsGabonGambia, TheGeorgiaGhanaGibraltarGrenadaGuatemalaGuineaGuinea-BissauGuyanaHaitiHeavily indebted poor countries (HIPC)High incomeHondurasHong Kong SAR, ChinaHungaryIBRD onlyIDA & IBRD totalIDA blendIDA onlyIDA totalIndiaIndonesiaIran, Islamic Rep.IraqIsraelJamaicaJordanKazakhstanKenyaKiribatiKorea, Dem. People’s Rep.Korea, Rep.KosovoKuwaitKyrgyz RepublicLao PDRLatin America & Caribbean Latin America & Caribbean (excluding high income)Latin America & the Caribbean (IDA & IBRD countries)LatviaLeast developed countries: UN classificationLebanonLesothoLiberiaLibyaLithuaniaLow & middle incomeLow incomeLower middle incomeMacao SAR, ChinaMacedonia, FYRMadagascarMalawiMalaysiaMaldivesMaliMaltaMarshall IslandsMauritaniaMauritiusMexicoMiddle East & North AfricaMiddle East & North Africa (excluding high income)Middle East & North Africa (IDA & IBRD countries)Middle incomeMoldovaMongoliaMontenegroMoroccoMozambiqueMyanmarNamibiaNauruNepalNicaraguaNigerNigeriaNorth AmericaOECD membersOmanOther small statesPacific island small statesPakistanPanamaPapua New GuineaParaguayPeruPhilippinesPolandRomaniaRussian FederationRwandaSamoaSao Tome and PrincipeSaudi ArabiaSenegalSerbiaSeychellesSierra LeoneSingaporeSlovak RepublicSloveniaSmall statesSolomon IslandsSomaliaSouth AfricaSouth AsiaSouth Asia (IDA & IBRD)South SudanSri LankaSt. Kitts and NevisSt. LuciaSt. Vincent and the GrenadinesSub-Saharan Africa Sub-Saharan Africa (excluding high income)Sub-Saharan Africa (IDA & IBRD countries)SudanSurinameSwazilandSyrian Arab RepublicTajikistanTanzaniaThailandTimor-LesteTogoTongaTrinidad and TobagoTunisiaTurkeyTurkmenistanUgandaUkraineUnited Arab EmiratesUpper middle incomeUruguayUzbekistanVanuatuVenezuela, RBVietnamWest Bank and GazaWorldYemen, Rep.ZambiaZimbabwe

Linea del tempo:

Questa scala temporale mostra un grafico dal 1993 anno al 2015 anno. Central African Republic. I dati fino ad 1992 anno non disponibili. Il numero di osservazioni attuali secondo i date: 17.

La fonte (nome):

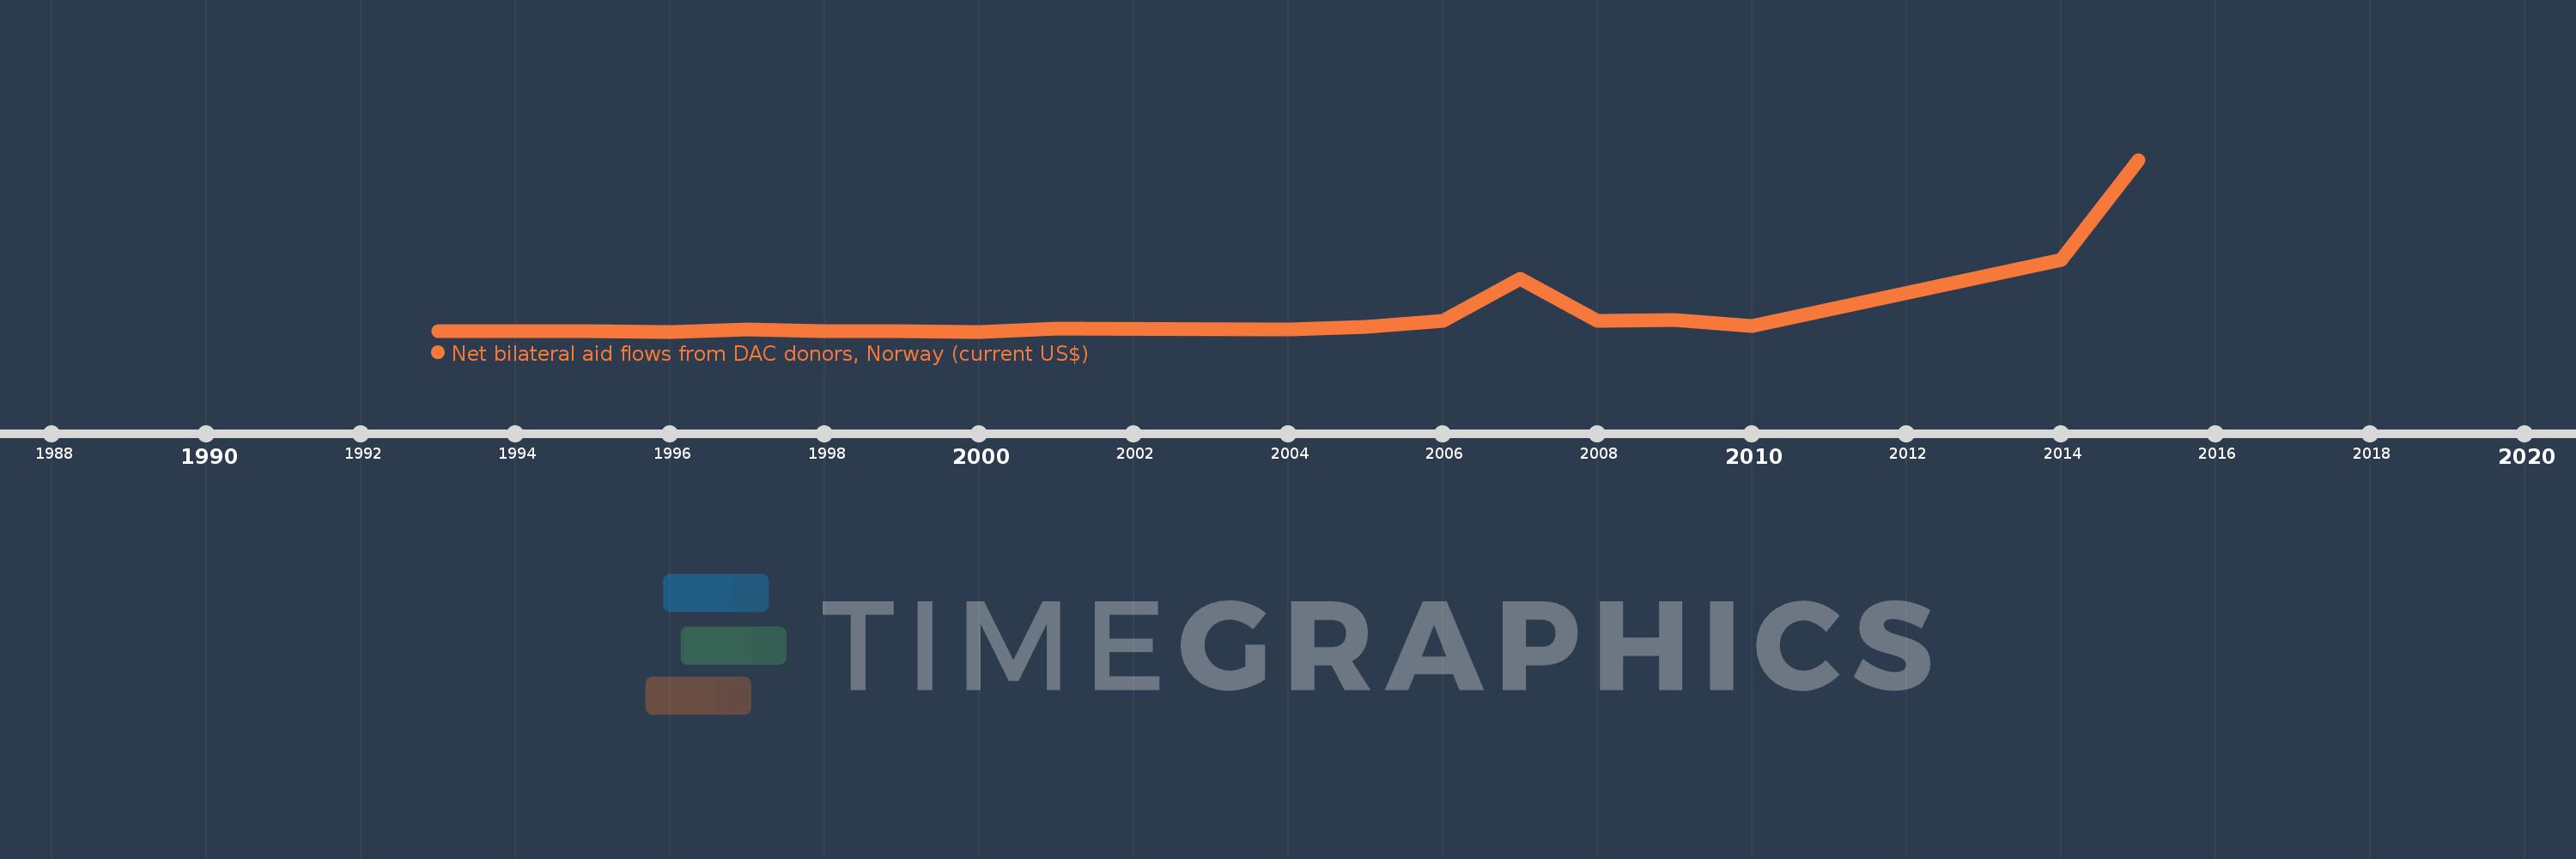
Indicatori dello sviluppo mondiale

La fonte (organizzazione):

Development Assistance Committee of the Organisation for Economic Co-operation and Development, Geographical Distribution of Financial Flows to Developing Countries, Development Co-operation Report, and International Development Statistics database. Data are available online at: www.oecd.org/dac/stats/idsonline.

Categorie:

Aid Effectiveness

sono stati aggiornati

23 apr 2017 anni

Indicatori delle variazioni dei valori per anni

In media:
2.204 Mln
Minima:
10.0 Mille.
1 gen 1996 anni
Massimo:
18.46 Mln
1 gen 2015 anni
Alla data di osservazione
Valore
Variazione assoluta
La variazione rispetto al valore precedente
1 gen 1993 anni
30.0 Mille.
+30.0 Mille.
0.0%
1 gen 1995 anni
20.0 Mille.
-10.0 Mille.
-33.33%
1 gen 1996 anni
10.0 Mille.
-10.0 Mille.
-50.0%
1 gen 1997 anni
270.0 Mille.
+260.0 Mille.
2.6 Mille.%
1 gen 1998 anni
60.0 Mille.
-210.0 Mille.
-77.78%
1 gen 1999 anni
20.0 Mille.
-40.0 Mille.
-66.67%
1 gen 2000 anni
10.0 Mille.
-10.0 Mille.
-50.0%
1 gen 2001 anni
320.0 Mille.
+310.0 Mille.
3.1 Mille.%
1 gen 2004 anni
220.0 Mille.
-100.0 Mille.
-31.25%
1 gen 2005 anni
490.0 Mille.
+270.0 Mille.
122.73%
1 gen 2006 anni
1.2 Mln
+710.0 Mille.
144.9%
1 gen 2007 anni
5.64 Mln
+4.44 Mln
370.0%
1 gen 2008 anni
1.15 Mln
-4.49 Mln
-79.61%
1 gen 2009 anni
1.23 Mln
+80.0 Mille.
6.96%
1 gen 2010 anni
640.0 Mille.
-590.0 Mille.
-47.97%
1 gen 2014 anni
7.7 Mln
+7.06 Mln
1.1 Mille.%
1 gen 2015 anni
18.46 Mln
+10.76 Mln
139.74%

Classificazione dei paesi secondo i statistiche attuali per anni