30
/it/
AIzaSyAYiBZKx7MnpbEhh9jyipgxe19OcubqV5w
April 1, 2024
115126
Croatia
HRV
true
2
1
Net bilateral aid flows from DAC donors, Norway (current US$)
2011,2010,2009,2008,2007,2006,2005,2004,2003,2002,2001,2000,1999,1998,1997,1996,1995
Download
Biblioteca di statistiche globali →Croatia →

Net bilateral aid flows from DAC donors, Norway (current US$)

Queste statistiche in altri paesi:

AfghanistanAlbaniaAlgeriaAngolaAntigua and BarbudaArab WorldArgentinaArmeniaAzerbaijanBahrainBangladeshBarbadosBelarusBelizeBeninBermudaBhutanBoliviaBosnia and HerzegovinaBotswanaBrazilBulgariaBurkina FasoBurundiCabo VerdeCambodiaCameroonCaribbean small statesCentral African RepublicCentral Europe and the BalticsChadChileChinaColombiaComorosCongo, Dem. Rep.Congo, Rep.Costa RicaCote d'IvoireCroatiaCubaCyprusCzech RepublicDjiboutiDominican RepublicEast Asia & PacificEast Asia & Pacific (excluding high income)East Asia & Pacific (IDA & IBRD countries)EcuadorEgypt, Arab Rep.El SalvadorEquatorial GuineaEritreaEstoniaEthiopiaEuro areaEurope & Central AsiaEurope & Central Asia (excluding high income)Europe & Central Asia (IDA & IBRD countries)European UnionFijiFragile and conflict affected situationsGabonGambia, TheGeorgiaGhanaGibraltarGrenadaGuatemalaGuineaGuinea-BissauGuyanaHaitiHeavily indebted poor countries (HIPC)High incomeHondurasHong Kong SAR, ChinaHungaryIBRD onlyIDA & IBRD totalIDA blendIDA onlyIDA totalIndiaIndonesiaIran, Islamic Rep.IraqIsraelJamaicaJordanKazakhstanKenyaKiribatiKorea, Dem. People’s Rep.Korea, Rep.KosovoKuwaitKyrgyz RepublicLao PDRLatin America & Caribbean Latin America & Caribbean (excluding high income)Latin America & the Caribbean (IDA & IBRD countries)LatviaLeast developed countries: UN classificationLebanonLesothoLiberiaLibyaLithuaniaLow & middle incomeLow incomeLower middle incomeMacao SAR, ChinaMacedonia, FYRMadagascarMalawiMalaysiaMaldivesMaliMaltaMarshall IslandsMauritaniaMauritiusMexicoMiddle East & North AfricaMiddle East & North Africa (excluding high income)Middle East & North Africa (IDA & IBRD countries)Middle incomeMoldovaMongoliaMontenegroMoroccoMozambiqueMyanmarNamibiaNauruNepalNicaraguaNigerNigeriaNorth AmericaOECD membersOmanOther small statesPacific island small statesPakistanPanamaPapua New GuineaParaguayPeruPhilippinesPolandRomaniaRussian FederationRwandaSamoaSao Tome and PrincipeSaudi ArabiaSenegalSerbiaSeychellesSierra LeoneSingaporeSlovak RepublicSloveniaSmall statesSolomon IslandsSomaliaSouth AfricaSouth AsiaSouth Asia (IDA & IBRD)South SudanSri LankaSt. Kitts and NevisSt. LuciaSt. Vincent and the GrenadinesSub-Saharan Africa Sub-Saharan Africa (excluding high income)Sub-Saharan Africa (IDA & IBRD countries)SudanSurinameSwazilandSyrian Arab RepublicTajikistanTanzaniaThailandTimor-LesteTogoTongaTrinidad and TobagoTunisiaTurkeyTurkmenistanUgandaUkraineUnited Arab EmiratesUpper middle incomeUruguayUzbekistanVanuatuVenezuela, RBVietnamWest Bank and GazaWorldYemen, Rep.ZambiaZimbabwe

Linea del tempo:

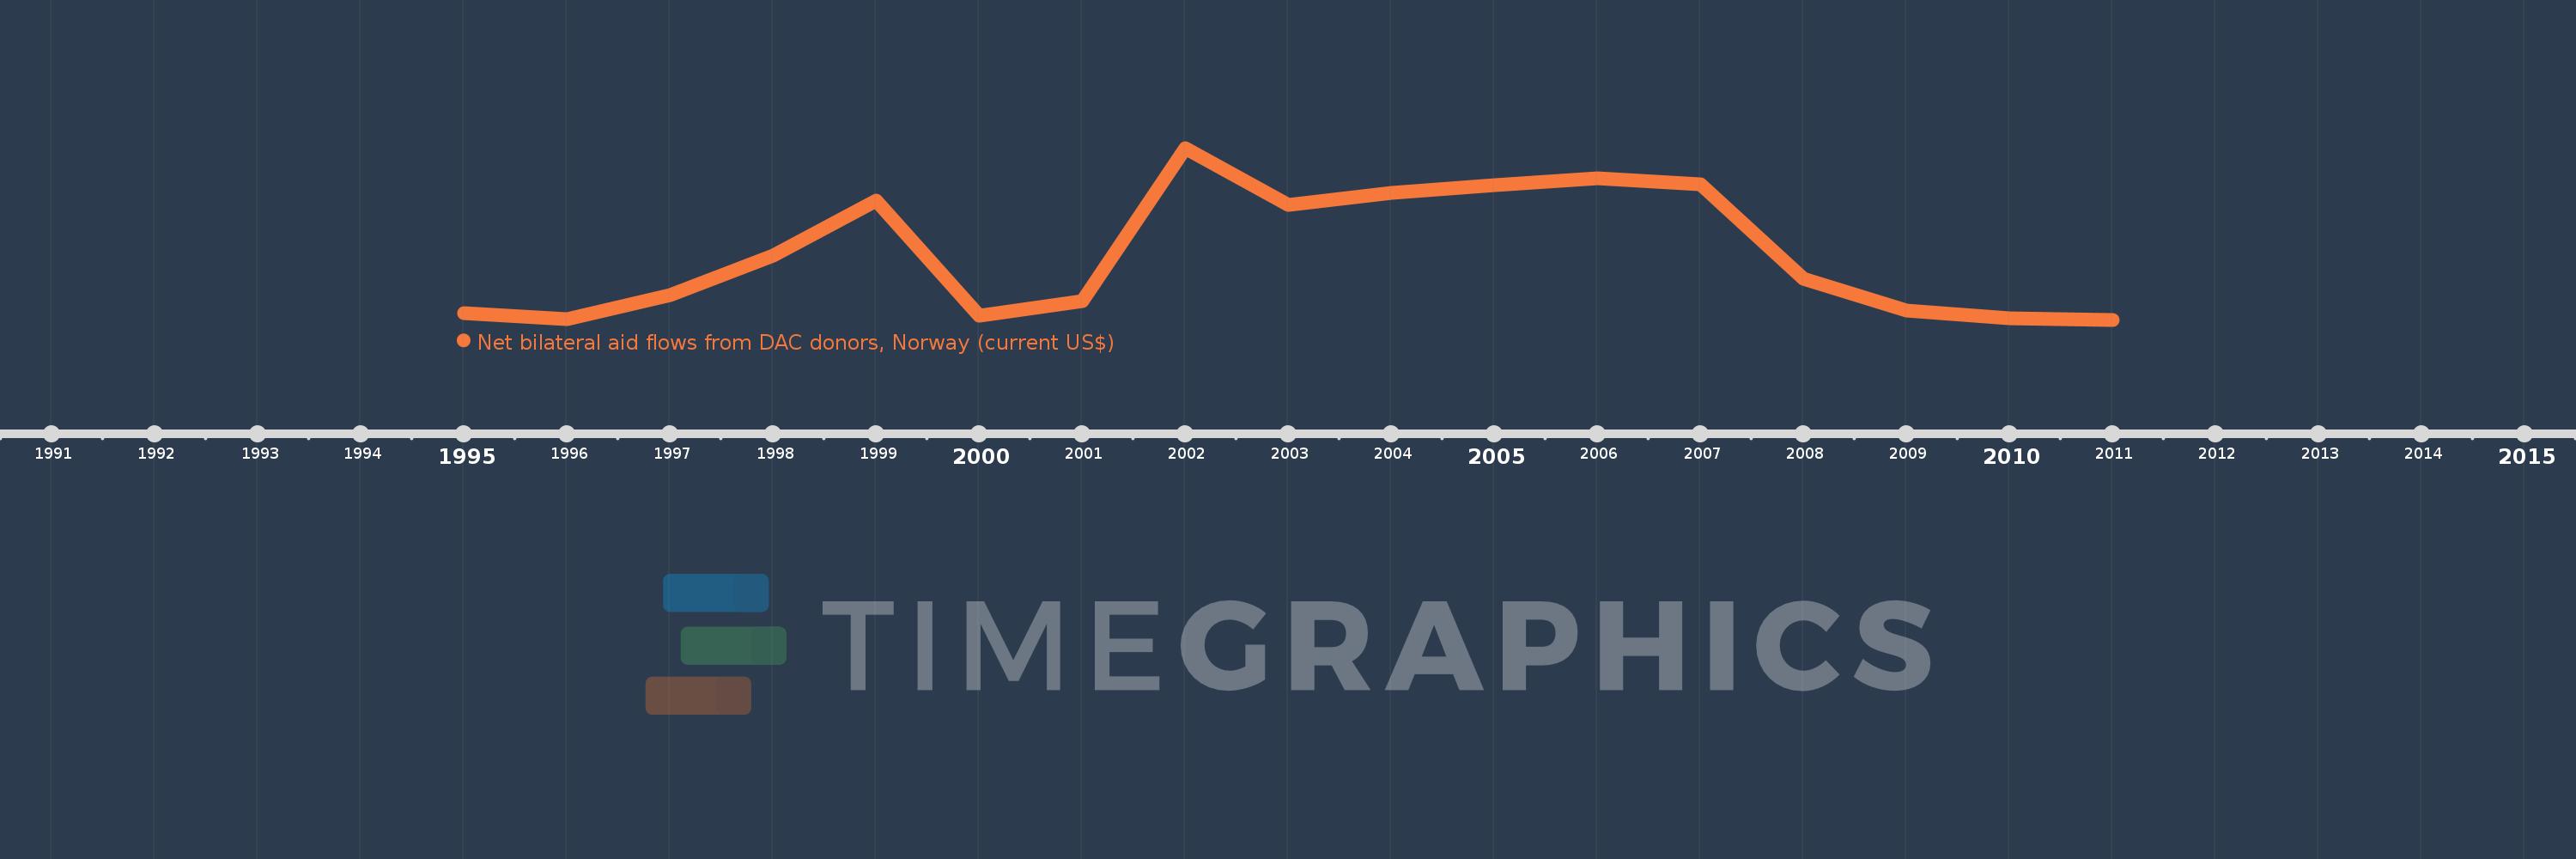
Questa scala temporale mostra un grafico dal 1995 anno al 2011 anno. Croatia. I dati fino ad 1994 anno non disponibili. Il numero di osservazioni attuali secondo i date: 17.

La fonte (nome):

Indicatori dello sviluppo mondiale

La fonte (organizzazione):

Development Assistance Committee of the Organisation for Economic Co-operation and Development, Geographical Distribution of Financial Flows to Developing Countries, Development Co-operation Report, and International Development Statistics database. Data are available online at: www.oecd.org/dac/stats/idsonline.

Categorie:

Aid Effectiveness

sono stati aggiornati

23 apr 2017 anni

Indicatori delle variazioni dei valori per anni

In media:
9.021 Mln
Minima:
3.46 Mln
1 gen 2011 anni
Massimo:
18.06 Mln
1 gen 2002 anni
Alla data di osservazione
Valore
Variazione assoluta
La variazione rispetto al valore precedente
1 gen 1995 anni
3.99 Mln
+3.99 Mln
0.0%
1 gen 1996 anni
3.49 Mln
-500.0 Mille.
-12.53%
1 gen 1997 anni
5.54 Mln
+2.05 Mln
58.74%
1 gen 1998 anni
8.93 Mln
+3.39 Mln
61.19%
1 gen 1999 anni
13.57 Mln
+4.64 Mln
51.96%
1 gen 2000 anni
3.83 Mln
-9.74 Mln
-71.78%
1 gen 2001 anni
5.02 Mln
+1.19 Mln
31.07%
1 gen 2002 anni
18.06 Mln
+13.04 Mln
259.76%
1 gen 2003 anni
13.19 Mln
-4.87 Mln
-26.97%
1 gen 2004 anni
14.22 Mln
+1.03 Mln
7.81%
1 gen 2005 anni
14.88 Mln
+660.0 Mille.
4.64%
1 gen 2006 anni
15.49 Mln
+610.0 Mille.
4.1%
1 gen 2007 anni
14.94 Mln
-550.0 Mille.
-3.55%
1 gen 2008 anni
6.92 Mln
-8.02 Mln
-53.68%
1 gen 2009 anni
4.23 Mln
-2.69 Mln
-38.87%
1 gen 2010 anni
3.6 Mln
-630.0 Mille.
-14.89%
1 gen 2011 anni
3.46 Mln
-140.0 Mille.
-3.89%

Classificazione dei paesi secondo i statistiche attuali per anni