29
/fr/
fr
AIzaSyAYiBZKx7MnpbEhh9jyipgxe19OcubqV5w
April 1, 2024
88952
Bosnia and Herzegovina
BIH
true
2
1
Net taxes on products (current US$)
2016,2015,2014,2013,2012,2011,2010,2009,2008,2007,2006,2005,2004,2003,2002,2001,2000,1999,1998,1997,1996,1995
Download
Bibliothèque de statistiques globales →Bosnia and Herzegovina →

Net taxes on products (current US$)

Cette statistique dans les autres pays:
AfghanistanAlbaniaAlgeriaAndorraAntigua and BarbudaArgentinaArmeniaArubaAustraliaAustriaAzerbaijanBahamas, TheBahrainBangladeshBarbadosBelarusBelgiumBelizeBeninBermudaBhutanBoliviaBosnia and HerzegovinaBotswanaBrazilBulgariaBurkina FasoBurundiCabo VerdeCambodiaCameroonCanadaCentral African RepublicChadChileColombiaCongo, Dem. Rep.Costa RicaCroatiaCubaCyprusCzech RepublicDenmarkDjiboutiDominicaDominican RepublicEcuadorEgypt, Arab Rep.El SalvadorEquatorial GuineaEritreaEstoniaEthiopiaFaroe IslandsFijiFinlandFranceGabonGambia, TheGeorgiaGermanyGhanaGreeceGrenadaGuatemalaGuineaGuinea-BissauGuyanaHondurasHong Kong SAR, ChinaHungaryIndiaIndonesiaIran, Islamic Rep.IrelandItalyJamaicaJapanJordanKazakhstanKenyaKiribatiKorea, Rep.KosovoKyrgyz RepublicLao PDRLatviaLebanonLesothoLiberiaLiechtensteinLithuaniaLuxembourgMacao SAR, ChinaMacedonia, FYRMadagascarMalawiMalaysiaMaldivesMaliMarshall IslandsMauritaniaMauritiusMexicoMicronesia, Fed. Sts.MoldovaMongoliaMontenegroMoroccoMozambiqueNamibiaNepalNetherlandsNew ZealandNicaraguaNigerNigeriaNorwayOmanPakistanPalauPanamaPapua New GuineaParaguayPeruPolandPortugalRomaniaRussian FederationRwandaSao Tome and PrincipeSenegalSerbiaSeychellesSierra LeoneSingaporeSlovak RepublicSloveniaSolomon IslandsSouth AfricaSpainSri LankaSt. Kitts and NevisSt. LuciaSt. Vincent and the GrenadinesSudanSurinameSwazilandSwedenSwitzerlandSyrian Arab RepublicTajikistanTanzaniaThailandTimor-LesteTongaTrinidad and TobagoTunisiaTurkeyTurkmenistanTuvaluUgandaUkraineUnited KingdomUnited StatesUruguayUzbekistanVanuatuVenezuela, RBVietnamWest Bank and GazaYemen, Rep.ZambiaZimbabwe
La ligne de temps
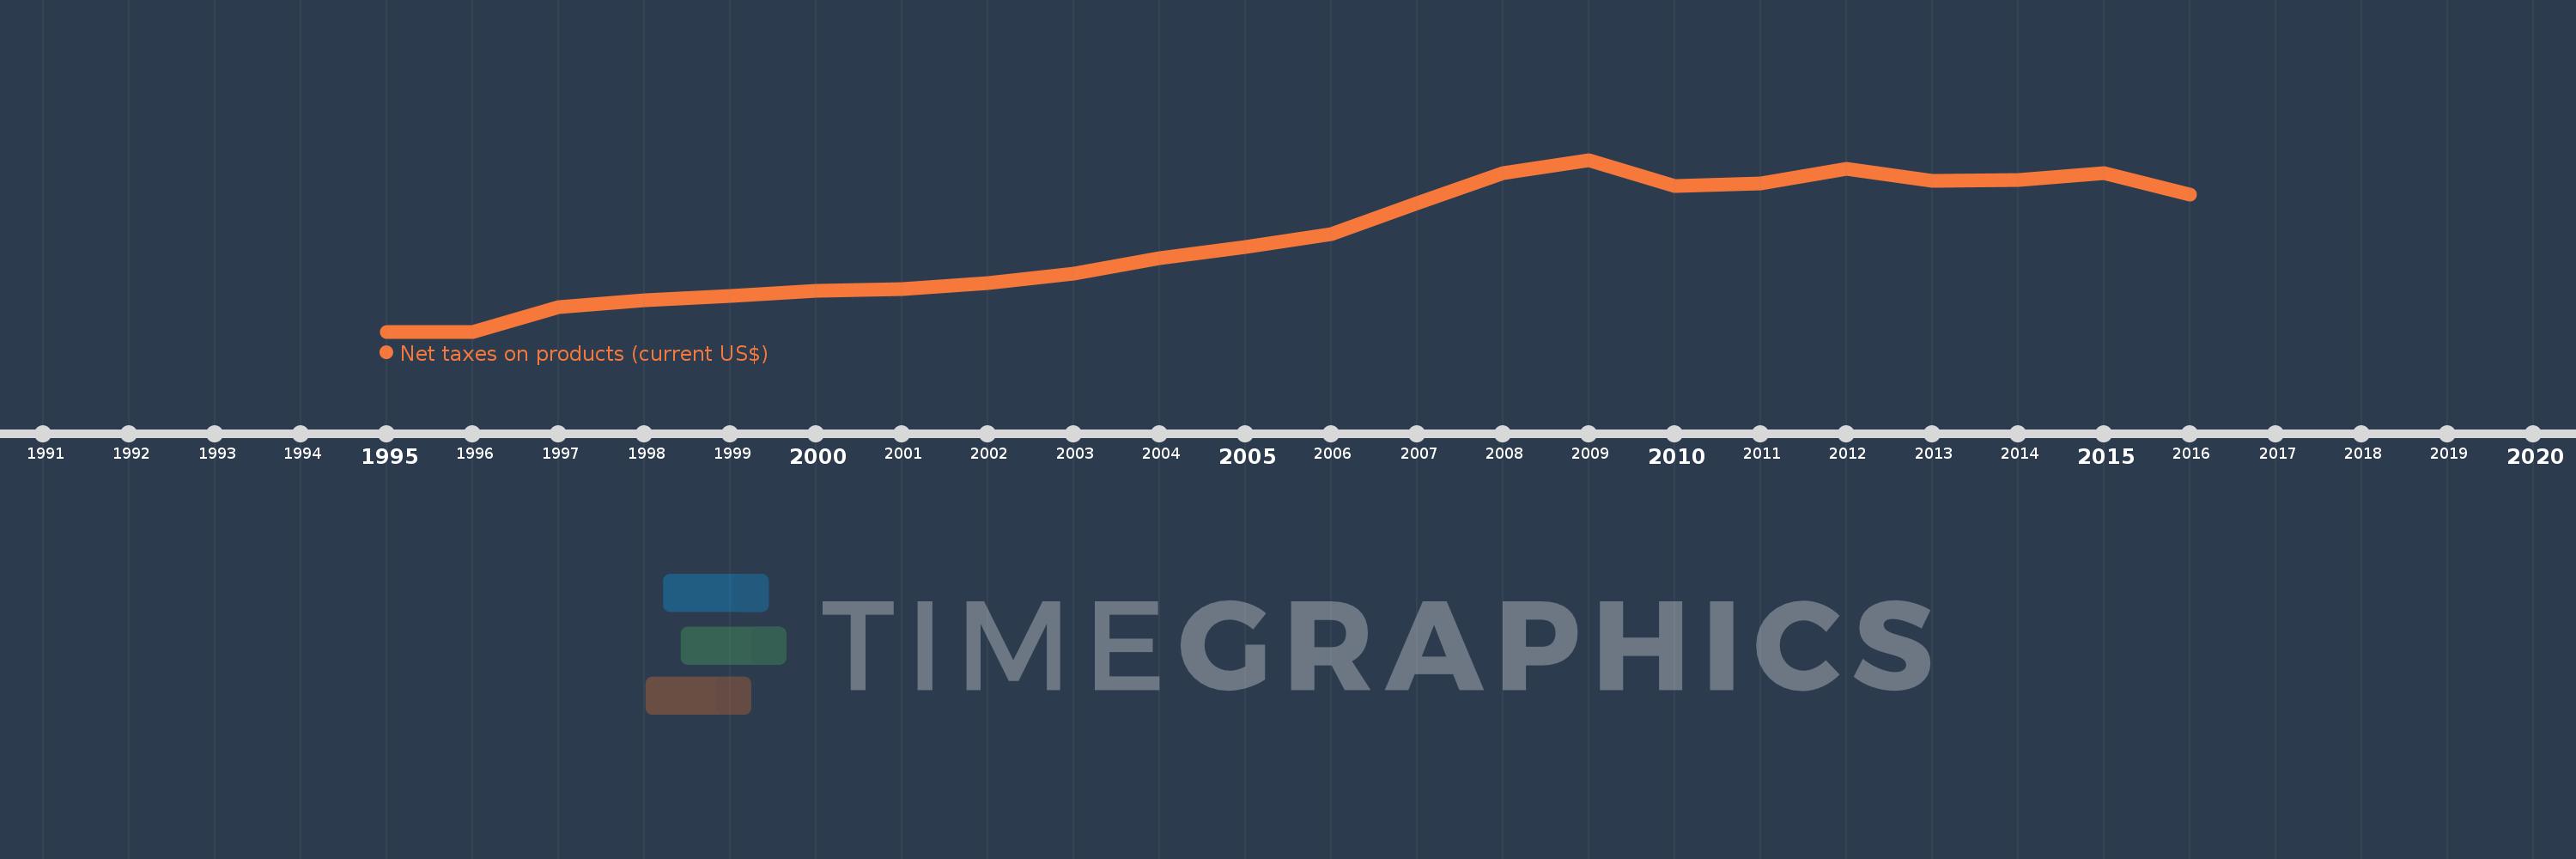
Cette échelle de temps montre un graphique de 1995 année à 2016 année Bosnia and Herzegovina. Les données jusqu'à 1994 année ne sont pas présentés. Quantité d'observations actuelles selon dates: 22.
Source (désignation):
Les indicateurs du développement mondiale
Source (organisation):
World Bank national accounts data, and OECD National Accounts data files.
Catégories:
Economy & Growth
Dernière mise à jour
23 avr. 2017
Les indicateurs de changement de valeurs selon les années
En moyenne:
1.929 mds
Minimum:
0.0
1 janv. 1995
Maximum:
3.558 mds
1 janv. 2009
Pour la date d''observation
Valeur
Changement absolu
Le changement par rapport à la valeur précédente
1 janv. 1995
0.0
0.0
0.0%
1 janv. 1996
0.0
0.0
%
1 janv. 1997
498.702 mln.
+498.702 mln.
%
1 janv. 1998
657.255 mln.
+158.553 mln.
31.79%
1 janv. 1999
736.889 mln.
+79.634 mln.
12.12%
1 janv. 2000
838.428 mln.
+101.538 mln.
13.78%
1 janv. 2001
873.819 mln.
+35.391 mln.
4.22%
1 janv. 2002
1.012 mds
+137.803 mln.
15.77%
1 janv. 2003
1.197 mds
+184.915 mln.
18.28%
1 janv. 2004
1.515 mds
+318.37 mln.
26.61%
1 janv. 2005
1.757 mds
+242.296 mln.
15.99%
1 janv. 2006
2.014 mds
+256.597 mln.
14.6%
1 janv. 2007
2.657 mds
+643.689 mln.
31.96%
1 janv. 2008
3.276 mds
+618.617 mln.
23.28%
1 janv. 2009
3.558 mds
+281.955 mln.
8.61%
1 janv. 2010
3.012 mds
-545.936 mln.
-15.34%
1 janv. 2011
3.075 mds
+62.555 mln.
2.08%
1 janv. 2012
3.363 mds
+288.182 mln.
9.37%
1 janv. 2013
3.127 mds
-235.836 mln.
-7.01%
1 janv. 2014
3.148 mds
+20.68 mln.
0.66%
1 janv. 2015
3.282 mds
+133.862 mln.
4.25%
1 janv. 2016
2.845 mds
-436.085 mln.
-13.29%
Classement des pays selon les statistiques actuelles par années

Commentaires:

Envoyer
PremiumAbout & FeedbackUn accordConfidentialité
logo
© 2022 Selected Technologies LLC – Morgan Hill, California