29
/fr/
fr
AIzaSyAYiBZKx7MnpbEhh9jyipgxe19OcubqV5w
April 1, 2024
188200
Malaysia
MYS
true
2
1
Net taxes on products (current US$)
1984,1983,1982,1981,1980,1979,1978,1977,1976,1975,1974,1973,1972,1971,1970,1969,1968,1967,1966,1965,1964,1963,1962,1961
Download
Bibliothèque de statistiques globales →Malaysia →

Net taxes on products (current US$)

Cette statistique dans les autres pays:
AfghanistanAlbaniaAlgeriaAndorraAntigua and BarbudaArgentinaArmeniaArubaAustraliaAustriaAzerbaijanBahamas, TheBahrainBangladeshBarbadosBelarusBelgiumBelizeBeninBermudaBhutanBoliviaBosnia and HerzegovinaBotswanaBrazilBulgariaBurkina FasoBurundiCabo VerdeCambodiaCameroonCanadaCentral African RepublicChadChileColombiaCongo, Dem. Rep.Costa RicaCroatiaCubaCyprusCzech RepublicDenmarkDjiboutiDominicaDominican RepublicEcuadorEgypt, Arab Rep.El SalvadorEquatorial GuineaEritreaEstoniaEthiopiaFaroe IslandsFijiFinlandFranceGabonGambia, TheGeorgiaGermanyGhanaGreeceGrenadaGuatemalaGuineaGuinea-BissauGuyanaHondurasHong Kong SAR, ChinaHungaryIndiaIndonesiaIran, Islamic Rep.IrelandItalyJamaicaJapanJordanKazakhstanKenyaKiribatiKorea, Rep.KosovoKyrgyz RepublicLao PDRLatviaLebanonLesothoLiberiaLiechtensteinLithuaniaLuxembourgMacao SAR, ChinaMacedonia, FYRMadagascarMalawiMalaysiaMaldivesMaliMarshall IslandsMauritaniaMauritiusMexicoMicronesia, Fed. Sts.MoldovaMongoliaMontenegroMoroccoMozambiqueNamibiaNepalNetherlandsNew ZealandNicaraguaNigerNigeriaNorwayOmanPakistanPalauPanamaPapua New GuineaParaguayPeruPolandPortugalRomaniaRussian FederationRwandaSao Tome and PrincipeSenegalSerbiaSeychellesSierra LeoneSingaporeSlovak RepublicSloveniaSolomon IslandsSouth AfricaSpainSri LankaSt. Kitts and NevisSt. LuciaSt. Vincent and the GrenadinesSudanSurinameSwazilandSwedenSwitzerlandSyrian Arab RepublicTajikistanTanzaniaThailandTimor-LesteTongaTrinidad and TobagoTunisiaTurkeyTurkmenistanTuvaluUgandaUkraineUnited KingdomUnited StatesUruguayUzbekistanVanuatuVenezuela, RBVietnamWest Bank and GazaYemen, Rep.ZambiaZimbabwe
La ligne de temps
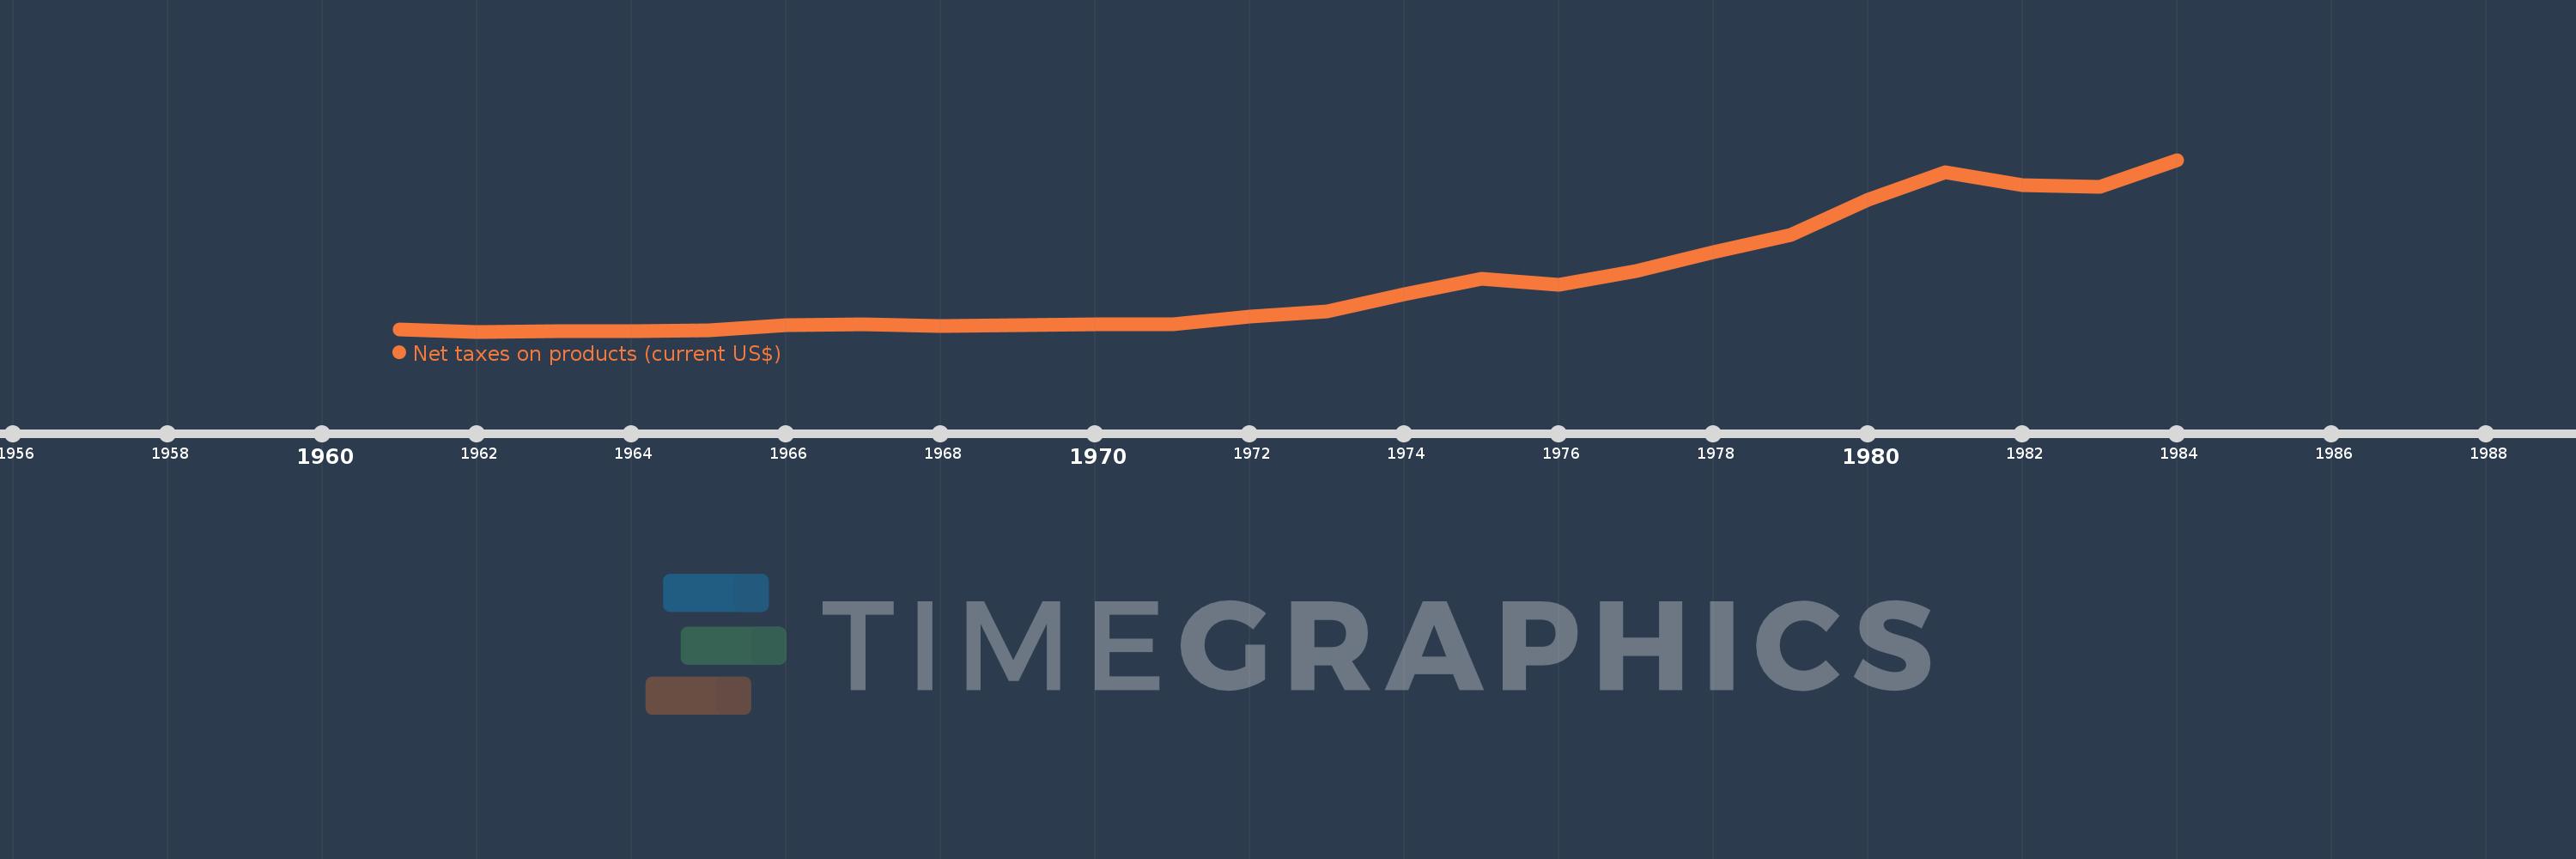
Cette échelle de temps montre un graphique de 1961 année à 1984 année Malaysia. Les données jusqu'à 1960 année ne sont pas présentés. Quantité d'observations actuelles selon dates: 24.
Source (désignation):
Les indicateurs du développement mondiale
Source (organisation):
World Bank national accounts data, and OECD National Accounts data files.
Catégories:
Economy & Growth
Dernière mise à jour
23 avr. 2017
Les indicateurs de changement de valeurs selon les années
En moyenne:
1.664 mds
Minimum:
287.122 mln.
1 janv. 1962
Maximum:
4.994 mds
1 janv. 1984
Pour la date d''observation
Valeur
Changement absolu
Le changement par rapport à la valeur précédente
1 janv. 1961
344.919 mln.
+344.919 mln.
0.0%
1 janv. 1962
287.122 mln.
-57.797 mln.
-16.76%
1 janv. 1963
294.579 mln.
+7.458 mln.
2.6%
1 janv. 1964
308.003 mln.
+13.424 mln.
4.56%
1 janv. 1965
316.207 mln.
+8.203 mln.
2.66%
1 janv. 1966
463.123 mln.
+146.917 mln.
46.46%
1 janv. 1967
483.473 mln.
+20.35 mln.
4.39%
1 janv. 1968
431.789 mln.
-51.684 mln.
-10.69%
1 janv. 1969
467.508 mln.
+35.719 mln.
8.27%
1 janv. 1970
483.888 mln.
+16.38 mln.
3.5%
1 janv. 1971
487.628 mln.
+3.74 mln.
0.77%
1 janv. 1972
692.954 mln.
+205.326 mln.
42.11%
1 janv. 1973
846.696 mln.
+153.742 mln.
22.19%
1 janv. 1974
1.314 mds
+466.928 mln.
55.15%
1 janv. 1975
1.731 mds
+417.832 mln.
31.81%
1 janv. 1976
1.57 mds
-161.384 mln.
-9.32%
1 janv. 1977
1.939 mds
+368.819 mln.
23.49%
1 janv. 1978
2.465 mds
+525.803 mln.
27.12%
1 janv. 1979
2.933 mds
+468.672 mln.
19.02%
1 janv. 1980
3.894 mds
+960.451 mln.
32.74%
1 janv. 1981
4.647 mds
+753.366 mln.
19.35%
1 janv. 1982
4.293 mds
-354.666 mln.
-7.63%
1 janv. 1983
4.242 mds
-50.655 mln.
-1.18%
1 janv. 1984
4.994 mds
+752.078 mln.
17.73%
Classement des pays selon les statistiques actuelles par années

Commentaires:

Envoyer
PremiumAbout & FeedbackUn accordConfidentialité
logo
© 2022 Selected Technologies LLC – Morgan Hill, California