29
/fr/
fr
AIzaSyAYiBZKx7MnpbEhh9jyipgxe19OcubqV5w
April 1, 2024
180649
Liechtenstein
LIE
true
2
1
Net taxes on products (current US$)
2015,2014,2013,2012,2011,2010,2009,2008,2007,2006,2005,2004,2003,2002,2001,2000,1999
Download
Bibliothèque de statistiques globales →Liechtenstein →

Net taxes on products (current US$)

Cette statistique dans les autres pays:
AfghanistanAlbaniaAlgeriaAndorraAntigua and BarbudaArgentinaArmeniaArubaAustraliaAustriaAzerbaijanBahamas, TheBahrainBangladeshBarbadosBelarusBelgiumBelizeBeninBermudaBhutanBoliviaBosnia and HerzegovinaBotswanaBrazilBulgariaBurkina FasoBurundiCabo VerdeCambodiaCameroonCanadaCentral African RepublicChadChileColombiaCongo, Dem. Rep.Costa RicaCroatiaCubaCyprusCzech RepublicDenmarkDjiboutiDominicaDominican RepublicEcuadorEgypt, Arab Rep.El SalvadorEquatorial GuineaEritreaEstoniaEthiopiaFaroe IslandsFijiFinlandFranceGabonGambia, TheGeorgiaGermanyGhanaGreeceGrenadaGuatemalaGuineaGuinea-BissauGuyanaHondurasHong Kong SAR, ChinaHungaryIndiaIndonesiaIran, Islamic Rep.IrelandItalyJamaicaJapanJordanKazakhstanKenyaKiribatiKorea, Rep.KosovoKyrgyz RepublicLao PDRLatviaLebanonLesothoLiberiaLiechtensteinLithuaniaLuxembourgMacao SAR, ChinaMacedonia, FYRMadagascarMalawiMalaysiaMaldivesMaliMarshall IslandsMauritaniaMauritiusMexicoMicronesia, Fed. Sts.MoldovaMongoliaMontenegroMoroccoMozambiqueNamibiaNepalNetherlandsNew ZealandNicaraguaNigerNigeriaNorwayOmanPakistanPalauPanamaPapua New GuineaParaguayPeruPolandPortugalRomaniaRussian FederationRwandaSao Tome and PrincipeSenegalSerbiaSeychellesSierra LeoneSingaporeSlovak RepublicSloveniaSolomon IslandsSouth AfricaSpainSri LankaSt. Kitts and NevisSt. LuciaSt. Vincent and the GrenadinesSudanSurinameSwazilandSwedenSwitzerlandSyrian Arab RepublicTajikistanTanzaniaThailandTimor-LesteTongaTrinidad and TobagoTunisiaTurkeyTurkmenistanTuvaluUgandaUkraineUnited KingdomUnited StatesUruguayUzbekistanVanuatuVenezuela, RBVietnamWest Bank and GazaYemen, Rep.ZambiaZimbabwe
La ligne de temps
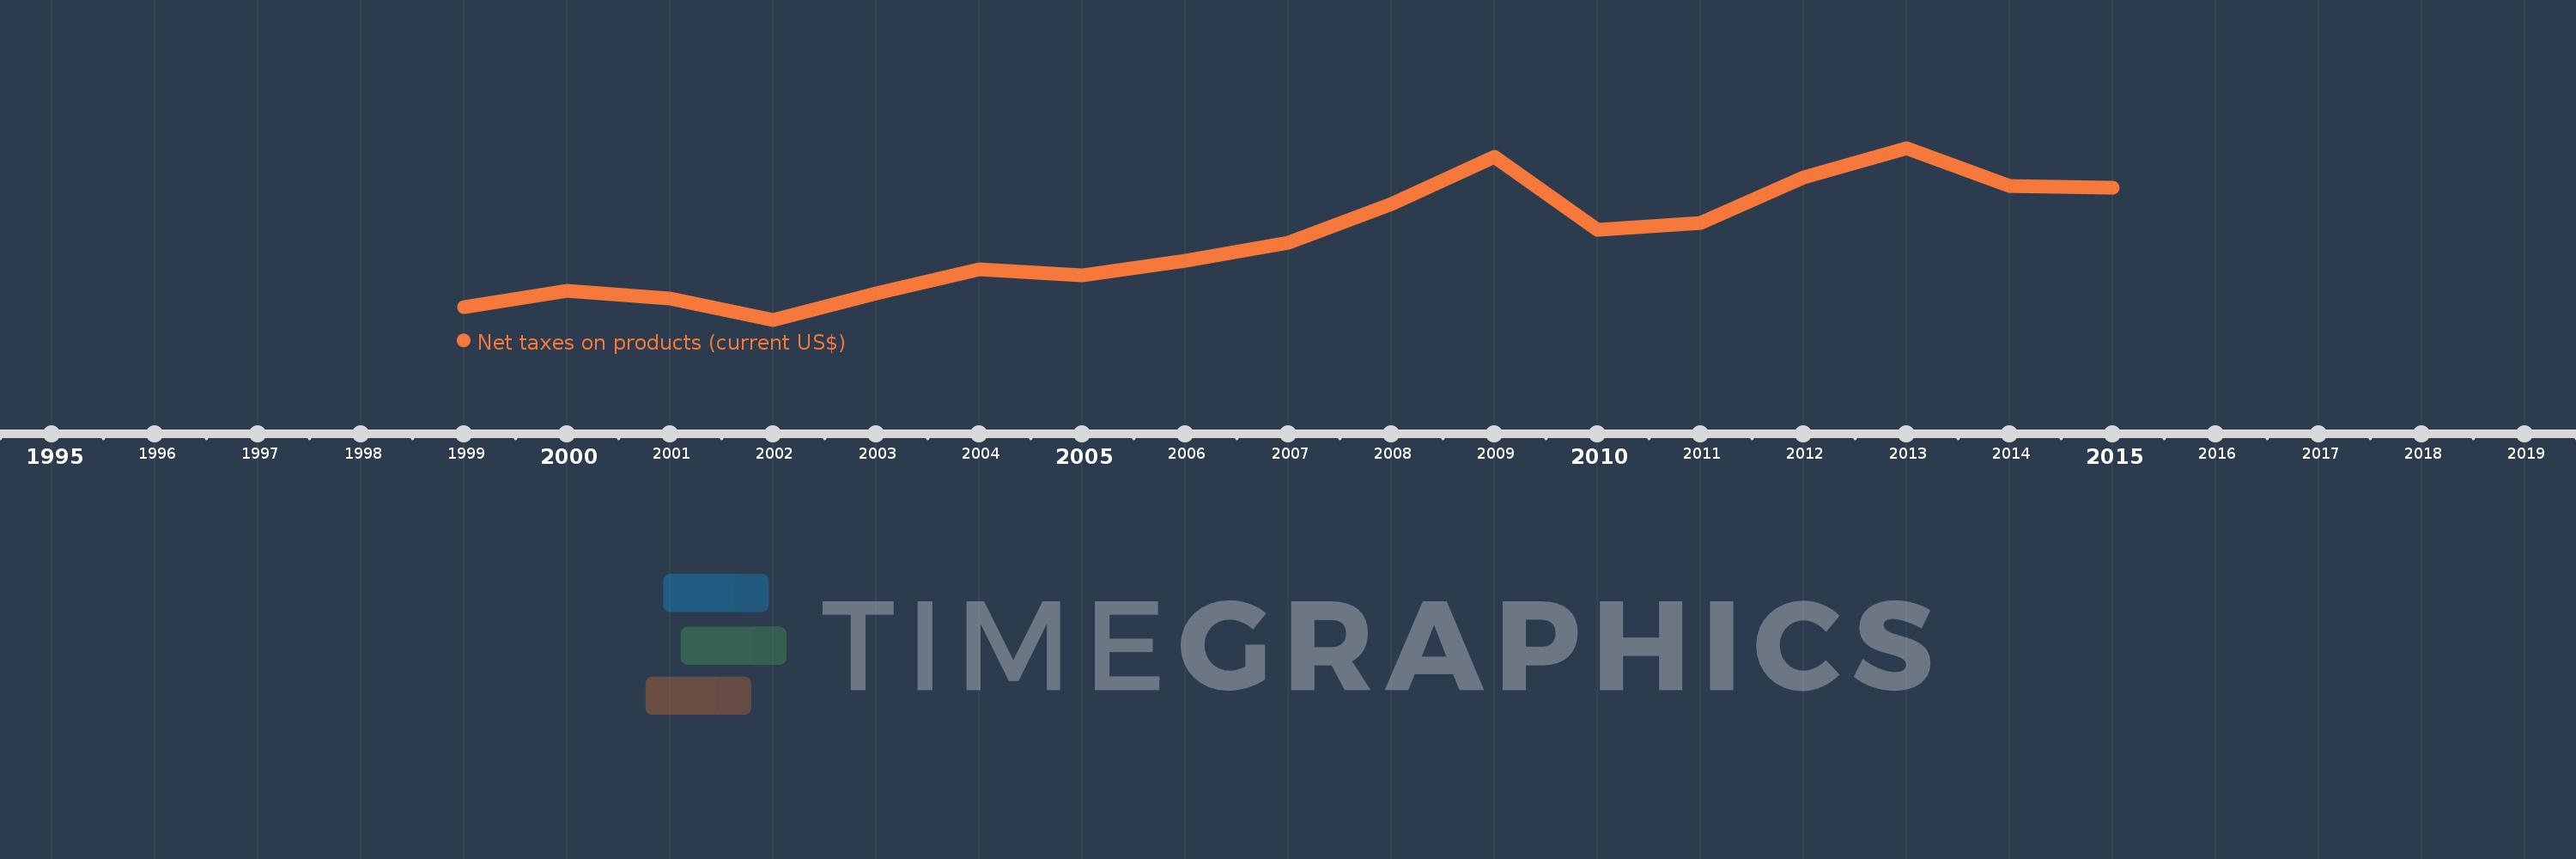
Cette échelle de temps montre un graphique de 1999 année à 2015 année Liechtenstein. Les données jusqu'à 1998 année ne sont pas présentés. Quantité d'observations actuelles selon dates: 17.
Source (désignation):
Les indicateurs du développement mondiale
Source (organisation):
World Bank national accounts data, and OECD National Accounts data files.
Catégories:
Economy & Growth
Dernière mise à jour
23 avr. 2017
Les indicateurs de changement de valeurs selon les années
En moyenne:
236.297 mln.
Minimum:
138.836 mln.
1 janv. 2002
Maximum:
347.339 mln.
1 janv. 2013
Pour la date d''observation
Valeur
Changement absolu
Le changement par rapport à la valeur précédente
1 janv. 1999
153.676 mln.
+153.676 mln.
0.0%
1 janv. 2000
173.878 mln.
+20.202 mln.
13.15%
1 janv. 2001
164.436 mln.
-9.442 mln.
-5.43%
1 janv. 2002
138.836 mln.
-25.6 mln.
-15.57%
1 janv. 2003
170.666 mln.
+31.83 mln.
22.93%
1 janv. 2004
200.49 mln.
+29.824 mln.
17.48%
1 janv. 2005
192.36 mln.
-8.13 mln.
-4.05%
1 janv. 2006
210.247 mln.
+17.887 mln.
9.3%
1 janv. 2007
232.812 mln.
+22.565 mln.
10.73%
1 janv. 2008
279.407 mln.
+46.595 mln.
20.01%
1 janv. 2009
336.165 mln.
+56.758 mln.
20.31%
1 janv. 2010
247.955 mln.
-88.21 mln.
-26.24%
1 janv. 2011
255.921 mln.
+7.966 mln.
3.21%
1 janv. 2012
311.712 mln.
+55.791 mln.
21.8%
1 janv. 2013
347.339 mln.
+35.628 mln.
11.43%
1 janv. 2014
301.651 mln.
-45.689 mln.
-13.15%
1 janv. 2015
299.498 mln.
-2.153 mln.
-0.71%
Classement des pays selon les statistiques actuelles par années

Commentaires:

Envoyer
PremiumAbout & FeedbackUn accordConfidentialité
logo
© 2022 Selected Technologies LLC – Morgan Hill, California