29
/fr/
fr
AIzaSyAYiBZKx7MnpbEhh9jyipgxe19OcubqV5w
April 1, 2024
79789
Barbados
BRB
true
2
1
Net taxes on products (current US$)
2015,2014,2013,2012,2011,2010,2009,2008,2007,2006,2005,2004,2003,2002,2001,2000,1999,1998,1997,1996,1995,1994,1993,1992,1991
Download
Bibliothèque de statistiques globales →Barbados →

Net taxes on products (current US$)

Cette statistique dans les autres pays:
AfghanistanAlbaniaAlgeriaAndorraAntigua and BarbudaArgentinaArmeniaArubaAustraliaAustriaAzerbaijanBahamas, TheBahrainBangladeshBarbadosBelarusBelgiumBelizeBeninBermudaBhutanBoliviaBosnia and HerzegovinaBotswanaBrazilBulgariaBurkina FasoBurundiCabo VerdeCambodiaCameroonCanadaCentral African RepublicChadChileColombiaCongo, Dem. Rep.Costa RicaCroatiaCubaCyprusCzech RepublicDenmarkDjiboutiDominicaDominican RepublicEcuadorEgypt, Arab Rep.El SalvadorEquatorial GuineaEritreaEstoniaEthiopiaFaroe IslandsFijiFinlandFranceGabonGambia, TheGeorgiaGermanyGhanaGreeceGrenadaGuatemalaGuineaGuinea-BissauGuyanaHondurasHong Kong SAR, ChinaHungaryIndiaIndonesiaIran, Islamic Rep.IrelandItalyJamaicaJapanJordanKazakhstanKenyaKiribatiKorea, Rep.KosovoKyrgyz RepublicLao PDRLatviaLebanonLesothoLiberiaLiechtensteinLithuaniaLuxembourgMacao SAR, ChinaMacedonia, FYRMadagascarMalawiMalaysiaMaldivesMaliMarshall IslandsMauritaniaMauritiusMexicoMicronesia, Fed. Sts.MoldovaMongoliaMontenegroMoroccoMozambiqueNamibiaNepalNetherlandsNew ZealandNicaraguaNigerNigeriaNorwayOmanPakistanPalauPanamaPapua New GuineaParaguayPeruPolandPortugalRomaniaRussian FederationRwandaSao Tome and PrincipeSenegalSerbiaSeychellesSierra LeoneSingaporeSlovak RepublicSloveniaSolomon IslandsSouth AfricaSpainSri LankaSt. Kitts and NevisSt. LuciaSt. Vincent and the GrenadinesSudanSurinameSwazilandSwedenSwitzerlandSyrian Arab RepublicTajikistanTanzaniaThailandTimor-LesteTongaTrinidad and TobagoTunisiaTurkeyTurkmenistanTuvaluUgandaUkraineUnited KingdomUnited StatesUruguayUzbekistanVanuatuVenezuela, RBVietnamWest Bank and GazaYemen, Rep.ZambiaZimbabwe
La ligne de temps
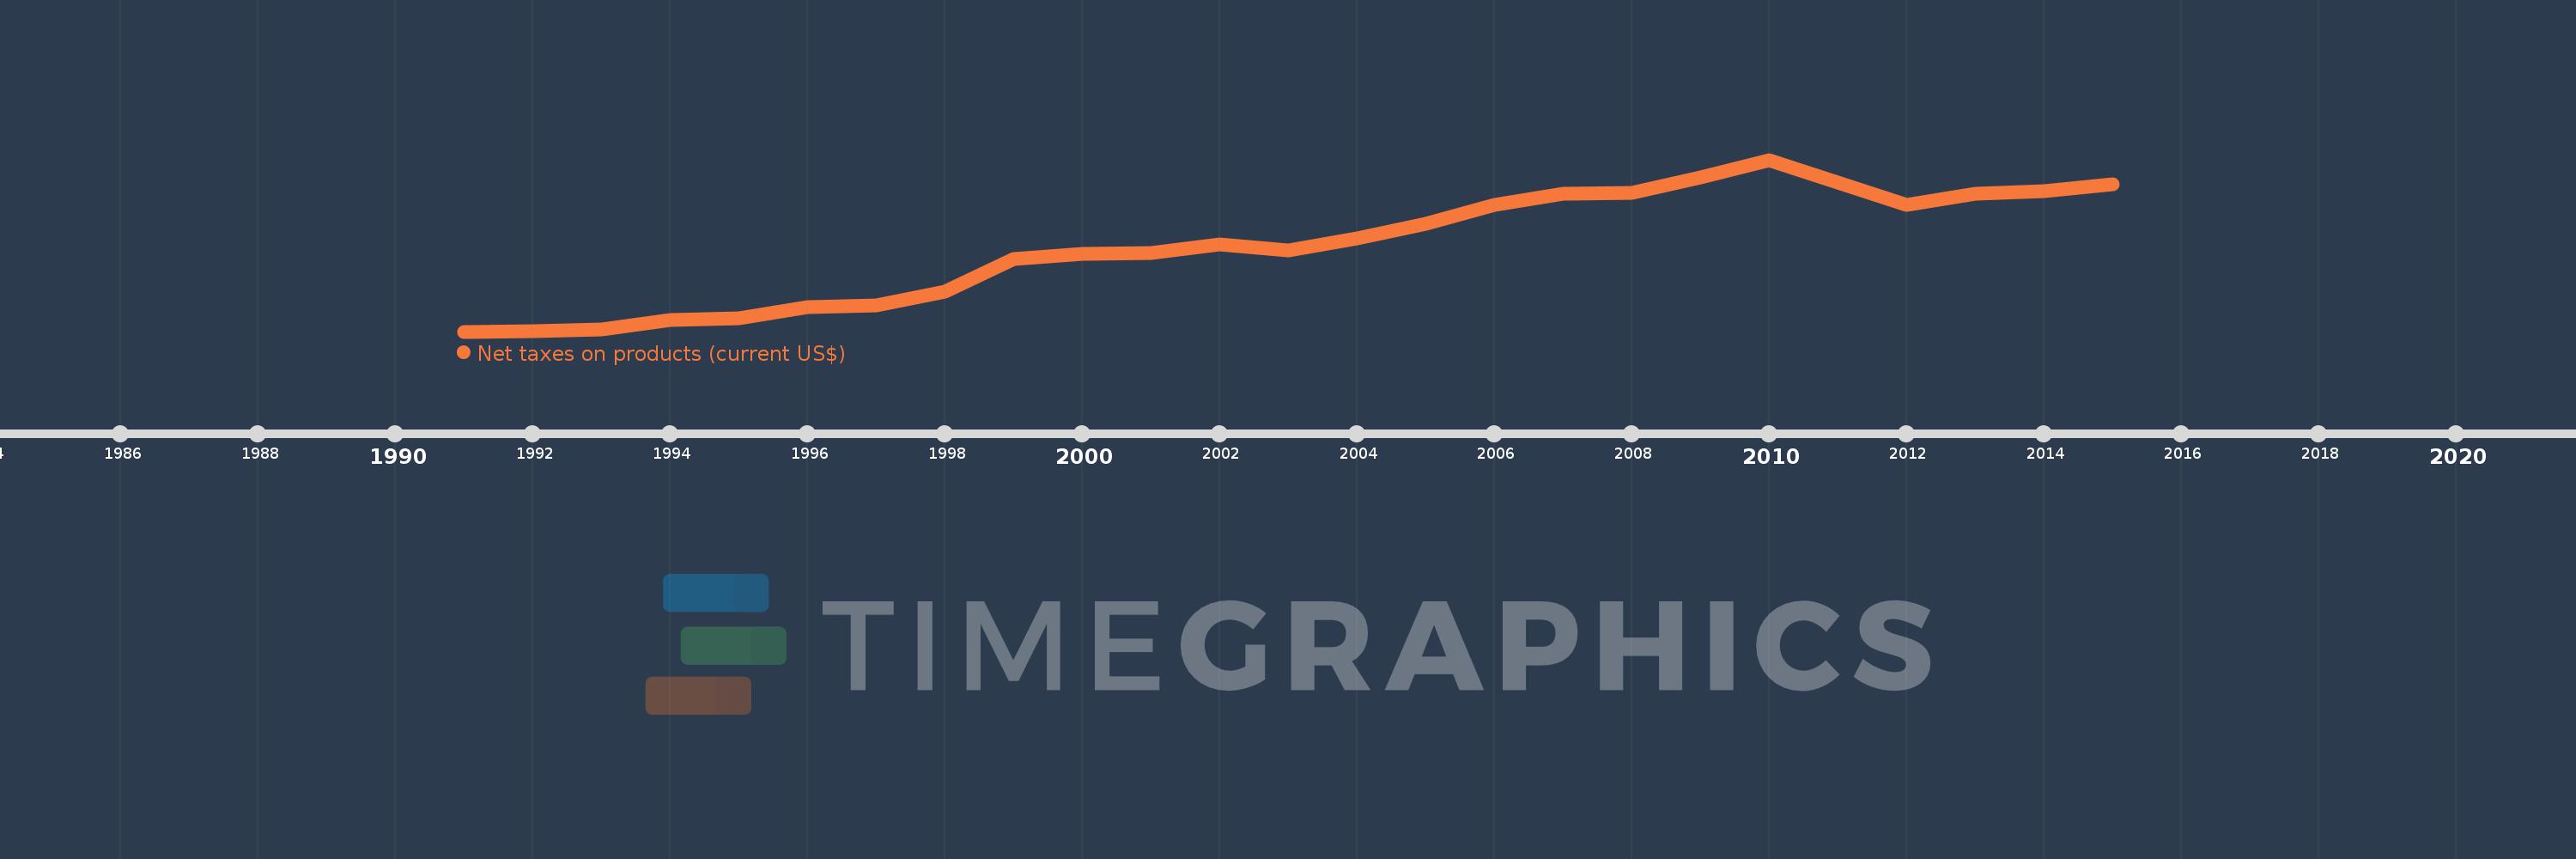
Cette échelle de temps montre un graphique de 1991 année à 2015 année Barbados. Les données jusqu'à 1990 année ne sont pas présentés. Quantité d'observations actuelles selon dates: 25.
Source (désignation):
Les indicateurs du développement mondiale
Source (organisation):
World Bank national accounts data, and OECD National Accounts data files.
Catégories:
Economy & Growth
Dernière mise à jour
23 avr. 2017
Les indicateurs de changement de valeurs selon les années
En moyenne:
490.406 mln.
Minimum:
214.538 mln.
1 janv. 1991
Maximum:
766.75 mln.
1 janv. 2010
Pour la date d''observation
Valeur
Changement absolu
Le changement par rapport à la valeur précédente
1 janv. 1991
214.538 mln.
+214.538 mln.
0.0%
1 janv. 1992
215.781 mln.
+1.243 mln.
0.58%
1 janv. 1993
222.0 mln.
+6.219 mln.
2.88%
1 janv. 1994
252.076 mln.
+30.076 mln.
13.55%
1 janv. 1995
256.252 mln.
+4.176 mln.
1.66%
1 janv. 1996
292.249 mln.
+35.997 mln.
14.05%
1 janv. 1997
300.104 mln.
+7.856 mln.
2.69%
1 janv. 1998
342.714 mln.
+42.609 mln.
14.2%
1 janv. 1999
448.367 mln.
+105.653 mln.
30.83%
1 janv. 2000
464.923 mln.
+16.556 mln.
3.69%
1 janv. 2001
466.55 mln.
+1.627 mln.
0.35%
1 janv. 2002
493.45 mln.
+26.9 mln.
5.77%
1 janv. 2003
474.8 mln.
-18.65 mln.
-3.78%
1 janv. 2004
513.3 mln.
+38.5 mln.
8.11%
1 janv. 2005
560.0 mln.
+46.7 mln.
9.1%
1 janv. 2006
620.6 mln.
+60.6 mln.
10.82%
1 janv. 2007
658.4 mln.
+37.8 mln.
6.09%
1 janv. 2008
660.45 mln.
+2.05 mln.
0.31%
1 janv. 2009
710.1 mln.
+49.65 mln.
7.52%
1 janv. 2010
766.75 mln.
+56.65 mln.
7.98%
1 janv. 2011
694.35 mln.
-72.4 mln.
-9.44%
1 janv. 2012
620.8 mln.
-73.55 mln.
-10.59%
1 janv. 2013
657.55 mln.
+36.75 mln.
5.92%
1 janv. 2014
666.0 mln.
+8.45 mln.
1.29%
1 janv. 2015
688.05 mln.
+22.05 mln.
3.31%
Classement des pays selon les statistiques actuelles par années

Commentaires:

Envoyer
PremiumAbout & FeedbackUn accordConfidentialité
logo
© 2022 Selected Technologies LLC – Morgan Hill, California