33
/fr/
AIzaSyAYiBZKx7MnpbEhh9jyipgxe19OcubqV5w
May 1, 2025
88308
Bosnia and Herzegovina
BIH
true
2
1
Commercial service imports (current US$)
2016,2015,2014,2013,2012,2011,2010,2009,2008,2007,2006,2005,2004,2003,2002,2001,2000,1999
Download
Bibliothèque de statistiques globales →Bosnia and Herzegovina →

Commercial service imports (current US$)

Cette statistique dans les autres pays:

AfghanistanAlbaniaAlgeriaAngolaAntigua and BarbudaArab WorldArgentinaArmeniaArubaAustraliaAustriaAzerbaijanBahamas, TheBahrainBangladeshBarbadosBelarusBelgiumBelizeBeninBermudaBhutanBoliviaBosnia and HerzegovinaBotswanaBrazilBrunei DarussalamBulgariaBurkina FasoBurundiCabo VerdeCambodiaCameroonCanadaCaribbean small statesCentral African RepublicCentral Europe and the BalticsChadChileChinaColombiaComorosCongo, Dem. Rep.Congo, Rep.Costa RicaCote d'IvoireCroatiaCuracaoCyprusCzech RepublicDenmarkDjiboutiDominicaDominican RepublicEarly-demographic dividendEast Asia & PacificEast Asia & Pacific (excluding high income)East Asia & Pacific (IDA & IBRD countries)EcuadorEgypt, Arab Rep.El SalvadorEquatorial GuineaEritreaEstoniaEthiopiaEuro areaEurope & Central AsiaEurope & Central Asia (excluding high income)Europe & Central Asia (IDA & IBRD countries)European UnionFaroe IslandsFijiFinlandFragile and conflict affected situationsFranceFrench PolynesiaGabonGambia, TheGeorgiaGermanyGhanaGreeceGrenadaGuatemalaGuineaGuinea-BissauGuyanaHaitiHeavily indebted poor countries (HIPC)High incomeHondurasHong Kong SAR, ChinaHungaryIBRD onlyIcelandIDA & IBRD totalIDA blendIDA onlyIDA totalIndiaIndonesiaIran, Islamic Rep.IraqIrelandIsraelItalyJamaicaJapanJordanKazakhstanKenyaKiribatiKorea, Rep.KosovoKuwaitKyrgyz RepublicLao PDRLate-demographic dividendLatin America & Caribbean Latin America & Caribbean (excluding high income)Latin America & the Caribbean (IDA & IBRD countries)LatviaLeast developed countries: UN classificationLebanonLesothoLiberiaLibyaLithuaniaLow & middle incomeLow incomeLower middle incomeLuxembourgMacao SAR, ChinaMacedonia, FYRMadagascarMalawiMalaysiaMaldivesMaliMaltaMarshall IslandsMauritaniaMauritiusMexicoMicronesia, Fed. Sts.Middle East & North Africa (excluding high income)Middle East & North Africa (IDA & IBRD countries)Middle incomeMoldovaMongoliaMontenegroMoroccoMozambiqueMyanmarNamibiaNepalNetherlandsNew CaledoniaNew ZealandNicaraguaNigerNigeriaNorth AmericaNorwayOECD membersOmanOther small statesPacific island small statesPakistanPalauPanamaPapua New GuineaParaguayPeruPhilippinesPolandPortugalPost-demographic dividendPre-demographic dividendQatarRomaniaRussian FederationRwandaSamoaSao Tome and PrincipeSaudi ArabiaSenegalSerbiaSeychellesSierra LeoneSingaporeSint Maarten (Dutch part)Slovak RepublicSloveniaSmall statesSolomon IslandsSouth AfricaSouth AsiaSouth Asia (IDA & IBRD)South SudanSpainSri LankaSt. Kitts and NevisSt. LuciaSt. Vincent and the GrenadinesSub-Saharan Africa Sub-Saharan Africa (excluding high income)Sub-Saharan Africa (IDA & IBRD countries)SudanSurinameSwazilandSwedenSwitzerlandSyrian Arab RepublicTajikistanTanzaniaThailandTimor-LesteTogoTongaTrinidad and TobagoTunisiaTurkeyTuvaluUgandaUkraineUnited KingdomUnited StatesUpper middle incomeUruguayVanuatuVenezuela, RBVietnamWest Bank and GazaWorldYemen, Rep.ZambiaZimbabwe

La ligne de temps

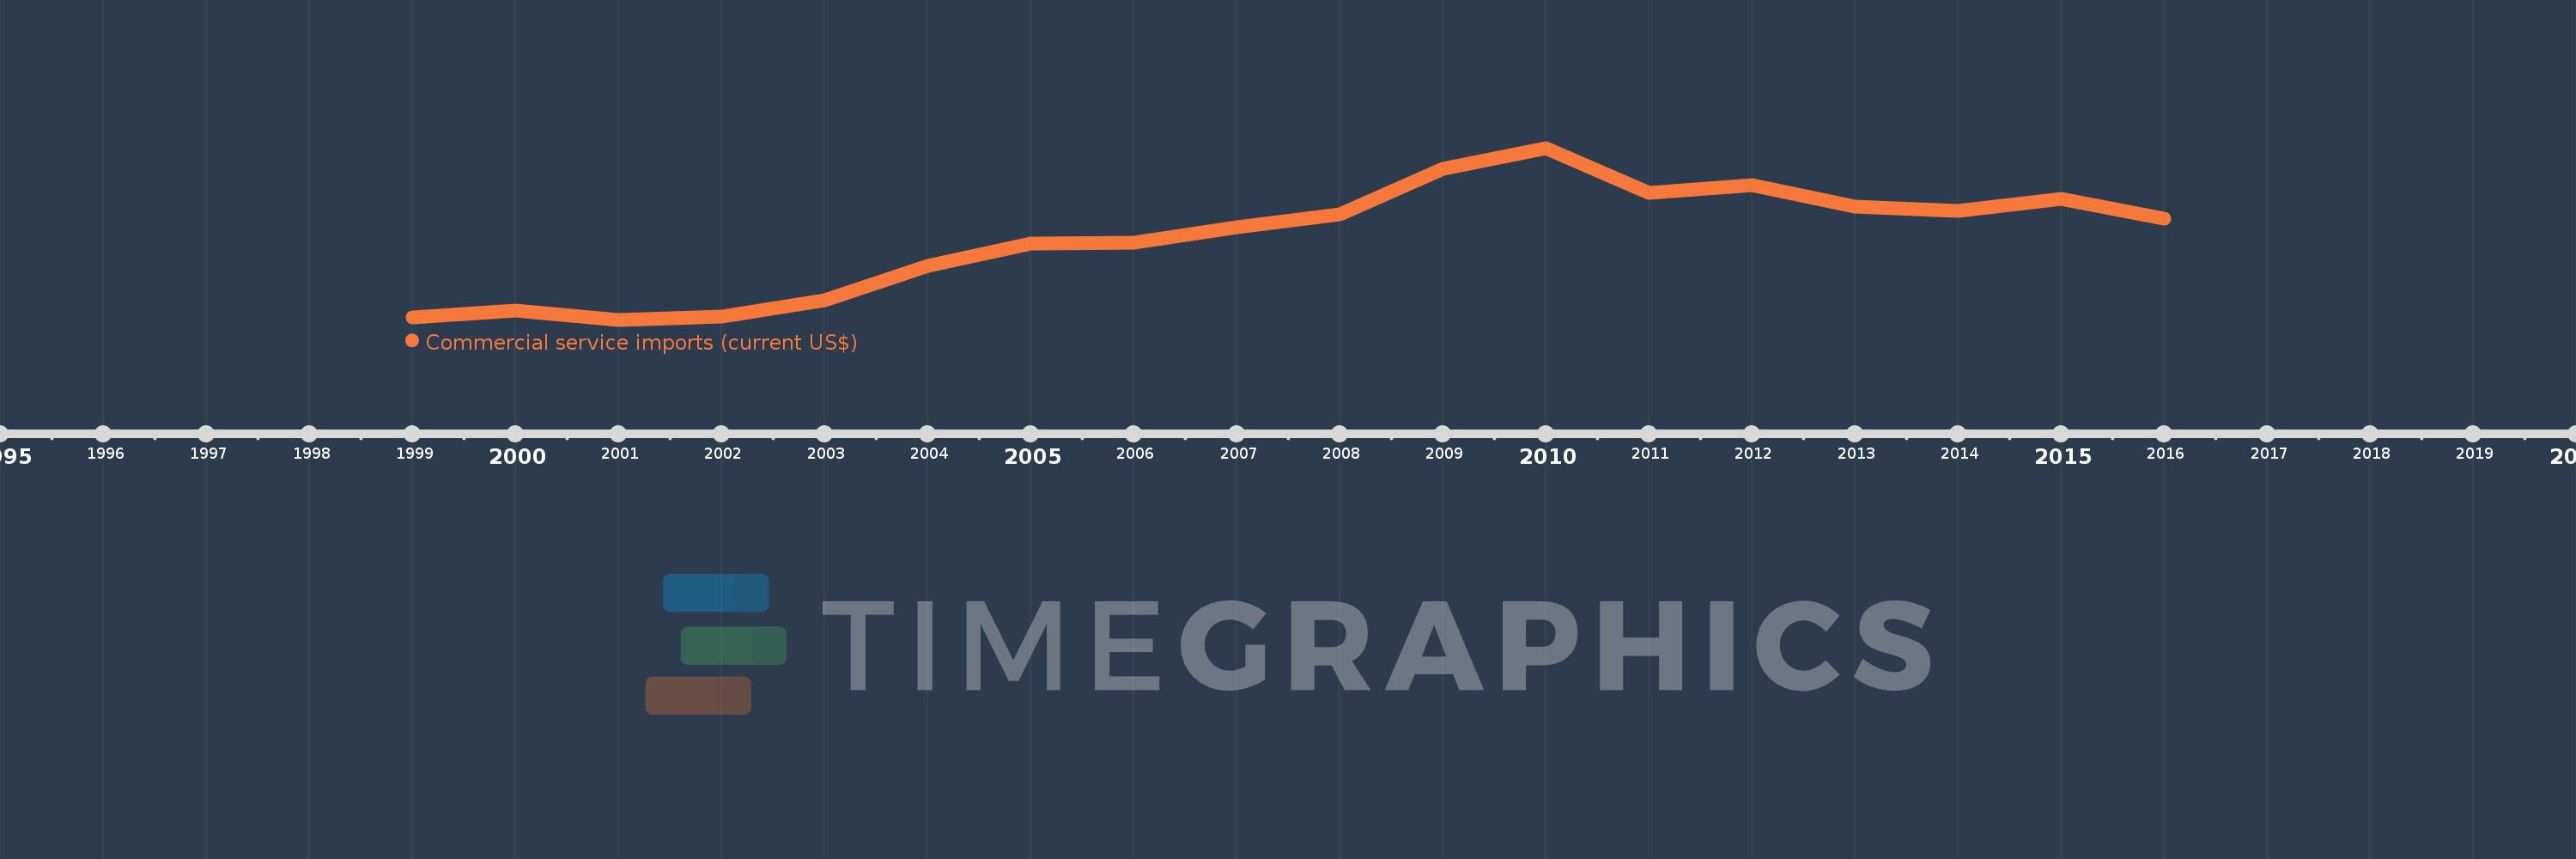
Cette échelle de temps montre un graphique de 1999 année à 2016 année Bosnia and Herzegovina. Les données jusqu'à 1998 année ne sont pas présentés. Quantité d'observations actuelles selon dates: 18.

Source (désignation):

Les indicateurs du développement mondiale

Source (organisation):

International Monetary Fund, Balance of Payments Statistics Yearbook and data files.

Catégories:

Private Sector, Trade

Dernière mise à jour

23 avr. 2017

Les indicateurs de changement de valeurs selon les années

En moyenne:
434.041 mln.
Minimum:
256.135 mln.
1 janv. 2001
Maximum:
631.149 mln.
1 janv. 2010
Pour la date d''observation
Valeur
Changement absolu
Le changement par rapport à la valeur précédente
1 janv. 1999
261.98 mln.
+261.98 mln.
0.0%
1 janv. 2000
276.735 mln.
+14.755 mln.
5.63%
1 janv. 2001
256.135 mln.
-20.601 mln.
-7.44%
1 janv. 2002
262.184 mln.
+6.05 mln.
2.36%
1 janv. 2003
297.97 mln.
+35.786 mln.
13.65%
1 janv. 2004
374.506 mln.
+76.536 mln.
25.69%
1 janv. 2005
422.429 mln.
+47.923 mln.
12.8%
1 janv. 2006
424.844 mln.
+2.415 mln.
0.57%
1 janv. 2007
458.018 mln.
+33.174 mln.
7.81%
1 janv. 2008
486.63 mln.
+28.612 mln.
6.25%
1 janv. 2009
585.07 mln.
+98.44 mln.
20.23%
1 janv. 2010
631.149 mln.
+46.079 mln.
7.88%
1 janv. 2011
533.121 mln.
-98.028 mln.
-15.53%
1 janv. 2012
549.201 mln.
+16.08 mln.
3.02%
1 janv. 2013
502.529 mln.
-46.672 mln.
-8.5%
1 janv. 2014
493.232 mln.
-9.297 mln.
-1.85%
1 janv. 2015
520.663 mln.
+27.431 mln.
5.56%
1 janv. 2016
476.351 mln.
-44.312 mln.
-8.51%

Classement des pays selon les statistiques actuelles par années