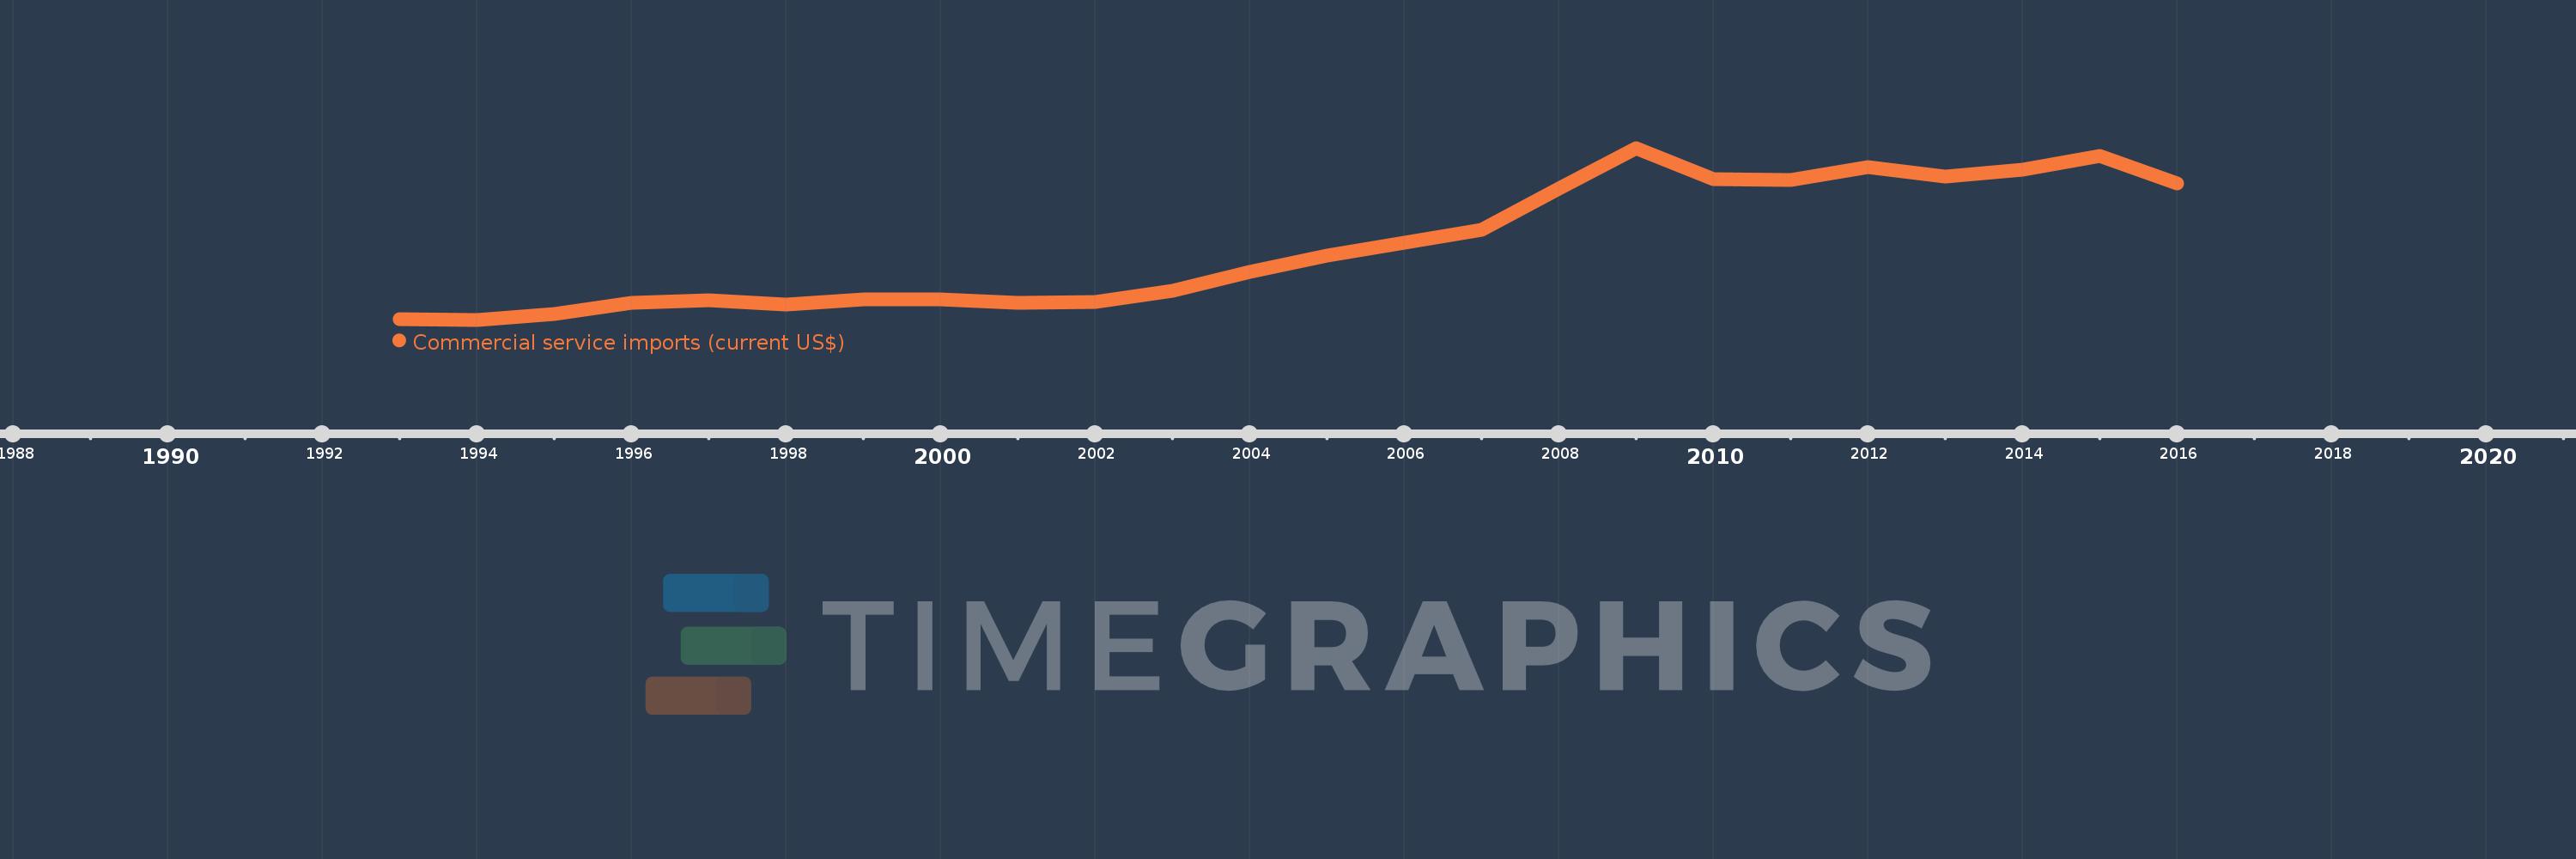
Cette échelle de temps montre un graphique de 1993 année à 2016 année Slovenia. Les données jusqu'à 1992 année ne sont pas présentés. Quantité d'observations actuelles selon dates: 24.
Source (désignation):
Les indicateurs du développement mondiale
Source (organisation):
International Monetary Fund, Balance of Payments Statistics Yearbook and data files.
Catégories:
Private Sector, Trade
Dernière mise à jour
23 avr. 2017
Les indicateurs de changement de valeurs selon les années
En moyenne:
2.829 mds
Minimum:
1.01 mds
1 janv. 1994
Maximum:
5.246 mds
1 janv. 2009
Pour la date d''observation
Valeur
Changement absolu
Le changement par rapport à la valeur précédente
1 janv. 1993
1.034 mds
+1.034 mds
0.0%
1 janv. 1994
1.01 mds
-24.0 mln.
-2.32%
1 janv. 1995
1.149 mds
+138.3 mln.
13.69%
1 janv. 1996
1.429 mds
+280.3 mln.
24.41%
1 janv. 1997
1.481 mds
+51.8 mln.
3.63%
1 janv. 1998
1.392 mds
-88.5 mln.
-5.98%
1 janv. 1999
1.51 mds
+117.8 mln.
8.46%
1 janv. 2000
1.506 mds
-3.8 mln.
-0.25%
1 janv. 2001
1.427 mds
-79.0 mln.
-5.25%
1 janv. 2002
1.453 mds
+26.3 mln.
1.84%
1 janv. 2003
1.73 mds
+276.5 mln.
19.02%
1 janv. 2004
2.183 mds
+453.4 mln.
26.21%
1 janv. 2005
2.593 mds
+409.6 mln.
18.76%
1 janv. 2006
2.899 mds
+306.5 mln.
11.82%
1 janv. 2007
3.235 mds
+336.072 mln.
11.59%
1 janv. 2008
4.253 mds
+1.017 mds
31.44%
1 janv. 2009
5.246 mds
+993.085 mln.
23.35%
1 janv. 2010
4.476 mds
-769.579 mln.
-14.67%
1 janv. 2011
4.463 mds
-13.321 mln.
-0.3%
1 janv. 2012
4.771 mds
+308.368 mln.
6.91%
1 janv. 2013
4.537 mds
-234.209 mln.
-4.91%
1 janv. 2014
4.7 mds
+162.888 mln.
3.59%
1 janv. 2015
5.054 mds
+354.2 mln.
7.54%
1 janv. 2016
4.374 mds
-679.801 mln.
-13.45%
Classement des pays selon les statistiques actuelles par années