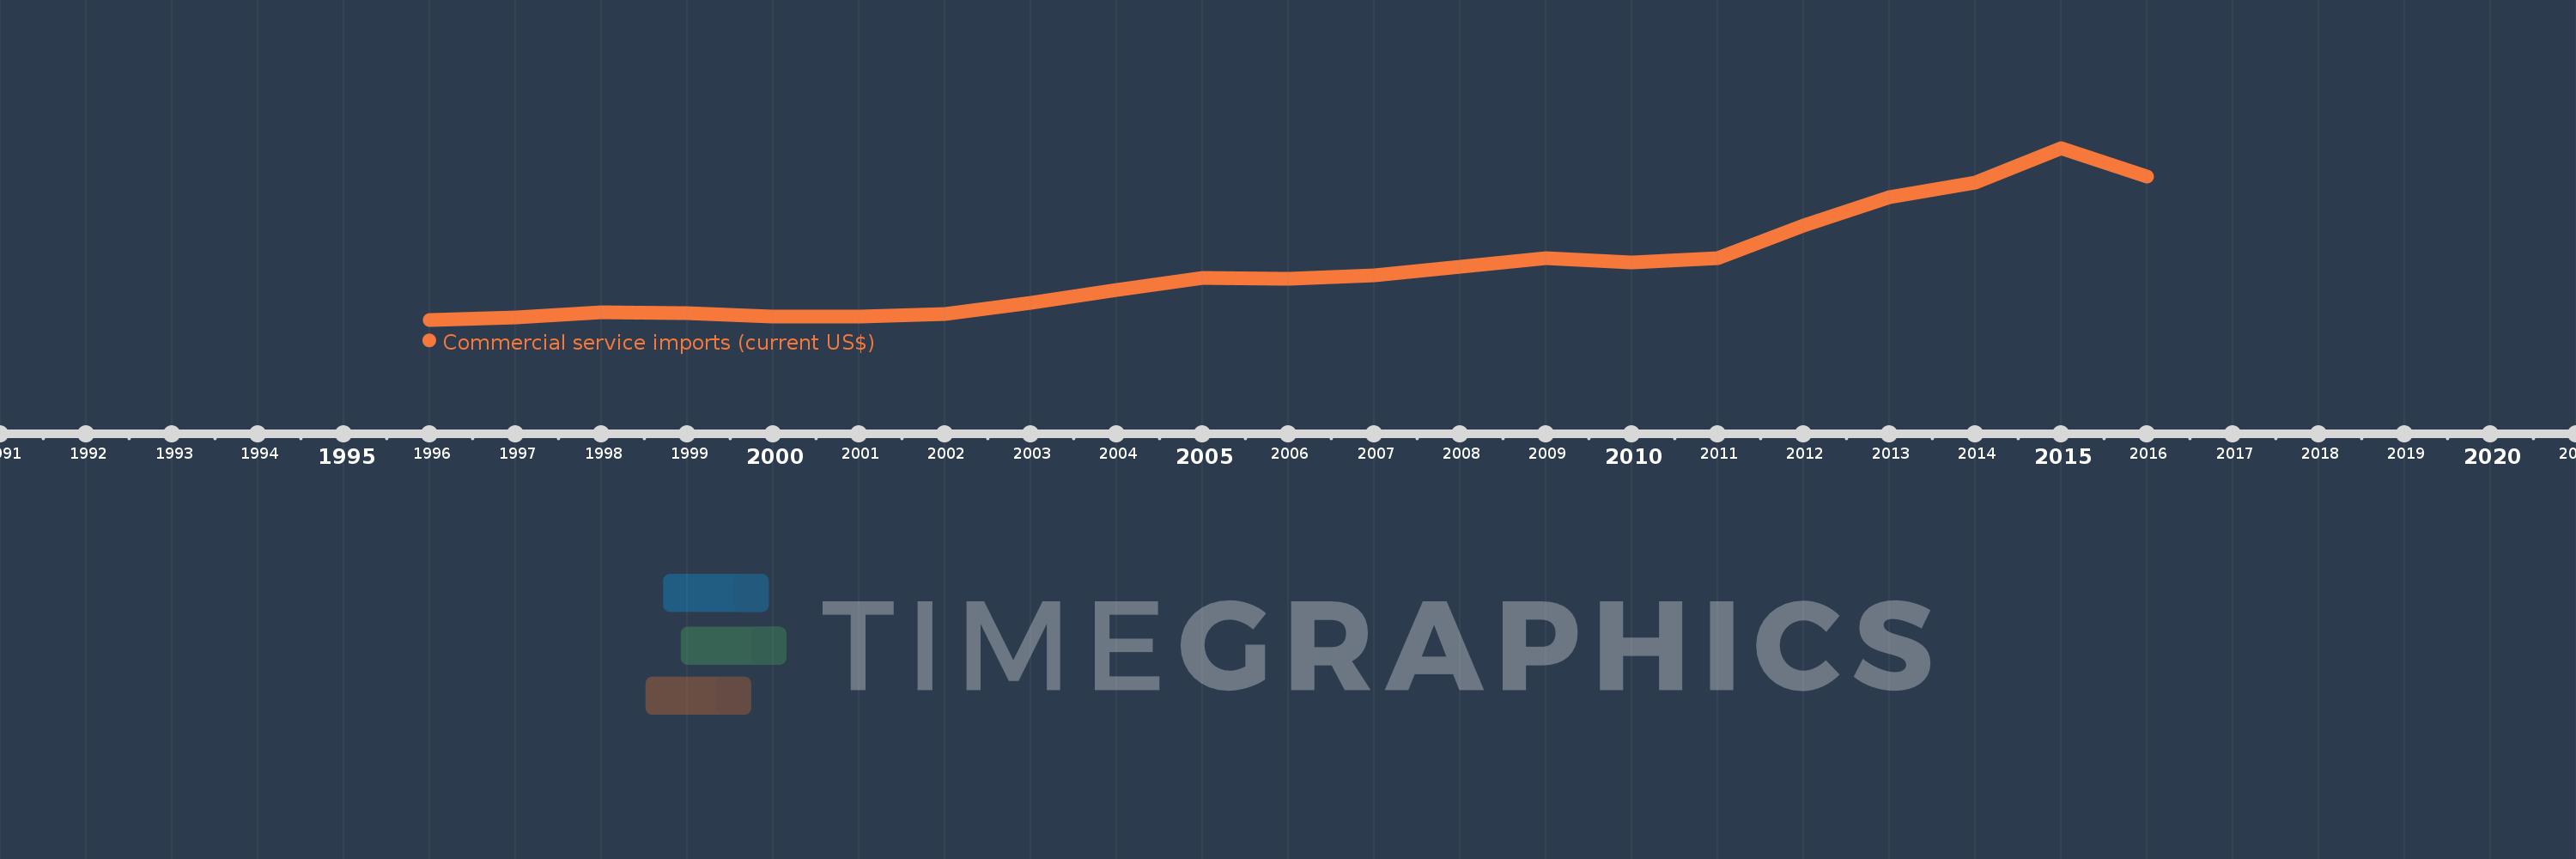
Cette échelle de temps montre un graphique de 1996 année à 2016 année Azerbaijan. Les données jusqu'à 1995 année ne sont pas présentés. Quantité d'observations actuelles selon dates: 21.
Source (désignation):
Les indicateurs du développement mondiale
Source (organisation):
International Monetary Fund, Balance of Payments Statistics Yearbook and data files.
Catégories:
Private Sector, Trade
Dernière mise à jour
23 avr. 2017
Les indicateurs de changement de valeurs selon les années
En moyenne:
3.328 mds
Minimum:
296.58 mln.
1 janv. 1996
Maximum:
10.187 mds
1 janv. 2015
Pour la date d''observation
Valeur
Changement absolu
Le changement par rapport à la valeur précédente
1 janv. 1996
296.58 mln.
+296.58 mln.
0.0%
1 janv. 1997
432.614 mln.
+136.034 mln.
45.87%
1 janv. 1998
714.127 mln.
+281.513 mln.
65.07%
1 janv. 1999
692.254 mln.
-21.873 mln.
-3.06%
1 janv. 2000
475.796 mln.
-216.458 mln.
-31.27%
1 janv. 2001
475.2 mln.
-596.0 milles
-0.13%
1 janv. 2002
650.254 mln.
+175.054 mln.
36.84%
1 janv. 2003
1.292 mds
+641.497 mln.
98.65%
1 janv. 2004
2.028 mds
+736.107 mln.
56.99%
1 janv. 2005
2.708 mds
+680.005 mln.
33.53%
1 janv. 2006
2.631 mds
-76.949 mln.
-2.84%
1 janv. 2007
2.859 mds
+228.328 mln.
8.68%
1 janv. 2008
3.331 mds
+471.864 mln.
16.5%
1 janv. 2009
3.852 mds
+521.218 mln.
15.65%
1 janv. 2010
3.613 mds
-239.629 mln.
-6.22%
1 janv. 2011
3.845 mds
+232.802 mln.
6.44%
1 janv. 2012
5.741 mds
+1.895 mds
49.29%
1 janv. 2013
7.33 mds
+1.589 mds
27.68%
1 janv. 2014
8.176 mds
+845.614 mln.
11.54%
1 janv. 2015
10.187 mds
+2.012 mds
24.61%
1 janv. 2016
8.553 mds
-1.634 mds
-16.04%
Classement des pays selon les statistiques actuelles par années